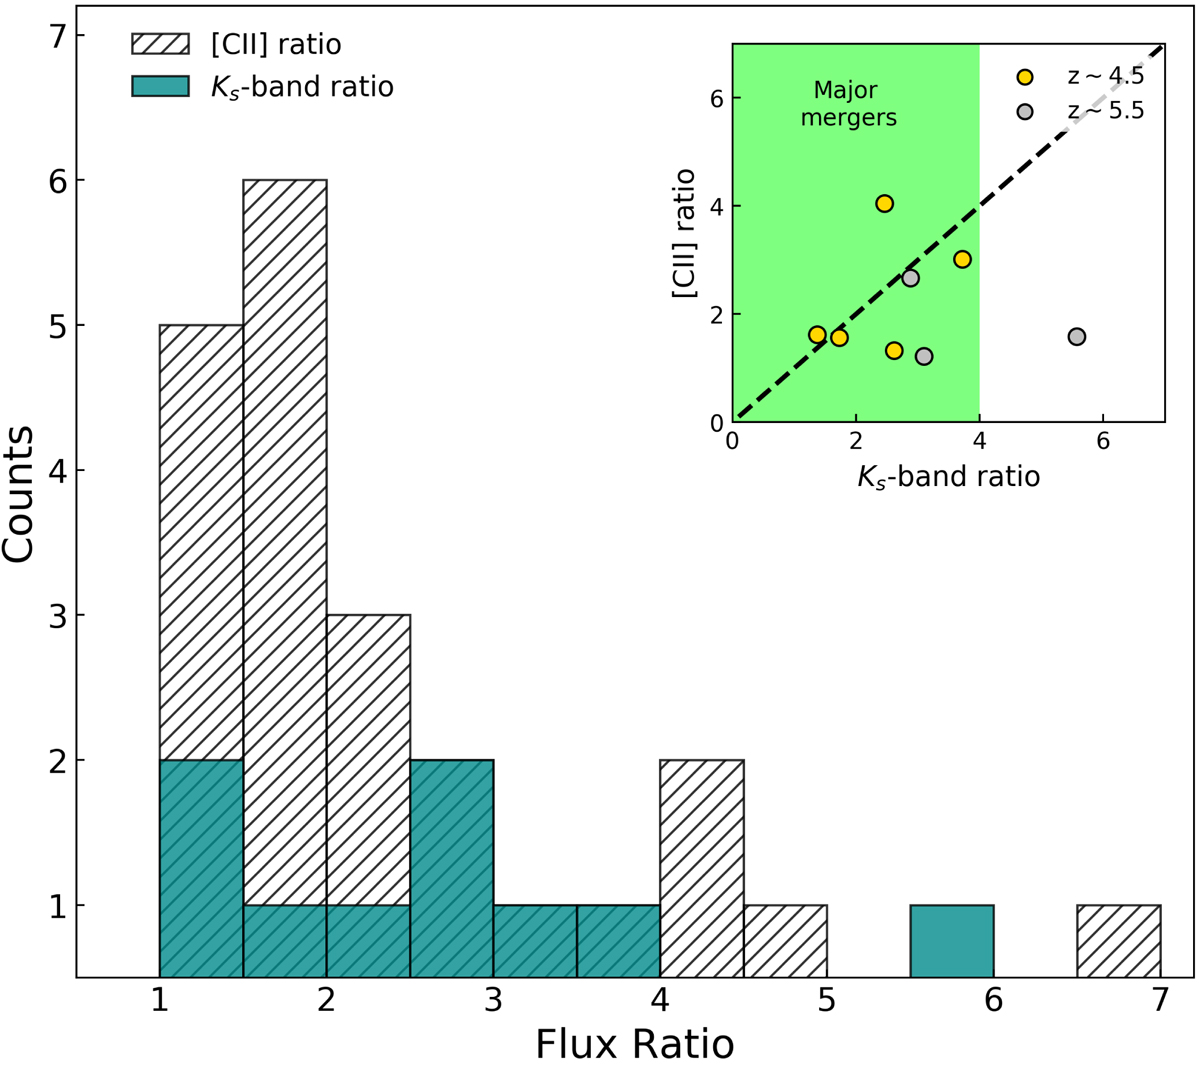
Fig. 3.
Download original image
Distributions of the Ks-band (turquoise histogram) and [CII] (hatched histogram) flux ratios between the components of each merging system. Inset: comparison between the [CII] and Ks-band ratios for the sources having this information in common, both at z ∼ 4.5 and z ∼ 5.5 (represented as yellow and gray circles, respectively). The green area marks the region of the figure with μK < 4. The dashed black line reports the 1:1 relation between the two quantities.
Current usage metrics show cumulative count of Article Views (full-text article views including HTML views, PDF and ePub downloads, according to the available data) and Abstracts Views on Vision4Press platform.
Data correspond to usage on the plateform after 2015. The current usage metrics is available 48-96 hours after online publication and is updated daily on week days.
Initial download of the metrics may take a while.