Fig. 2.
Download original image
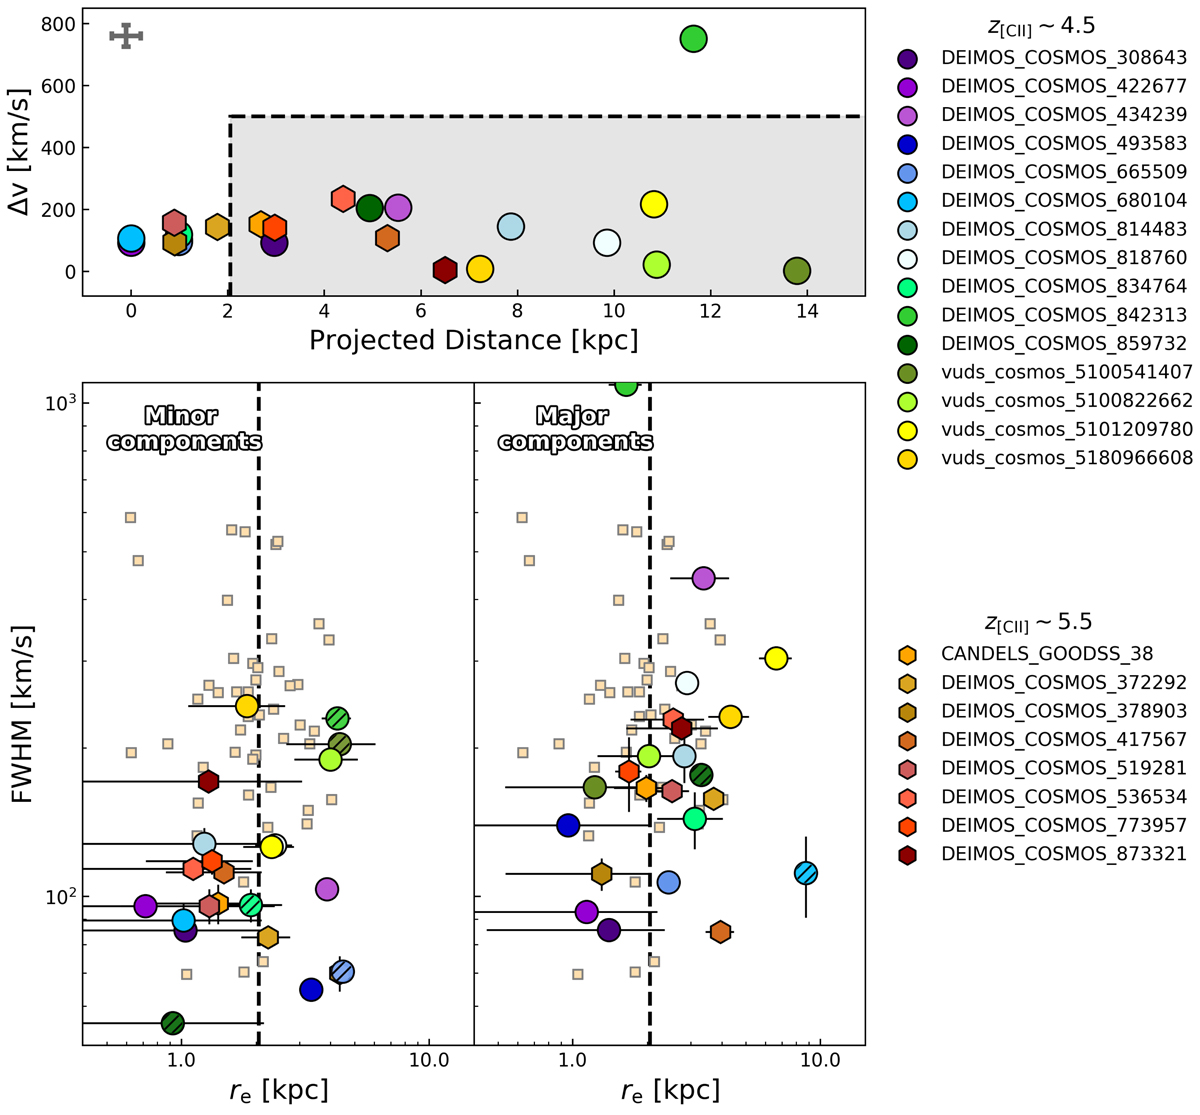
Top panel: velocity separation between the components of each ALPINE merger as a function of their projected distance. Each target is represented by its own color while the symbols are different for z ∼ 4.5 (circles) and z ∼ 5.5 (hexagons) galaxies. The gray shaded region shows the area of the plot populated by galaxies which are more likely to be real mergers, with a projected distance larger than >2.1 kpc and Δv < 500 km s−1. The error bar on the top-left corner represents the typical error on each value. Bottom panel: FWHM as a function of re for the minor (left) and major (right) components of each merger. The colors and symbols are the same as in the top panel. Hatched markers identify the sources for which the best-fit size estimate is not reliable, after a visual inspection of the residuals. The dashed black lines mark the average [CII] size of the ALPINE targets (as estimated in this work), represented with small light squares in the background.
Current usage metrics show cumulative count of Article Views (full-text article views including HTML views, PDF and ePub downloads, according to the available data) and Abstracts Views on Vision4Press platform.
Data correspond to usage on the plateform after 2015. The current usage metrics is available 48-96 hours after online publication and is updated daily on week days.
Initial download of the metrics may take a while.