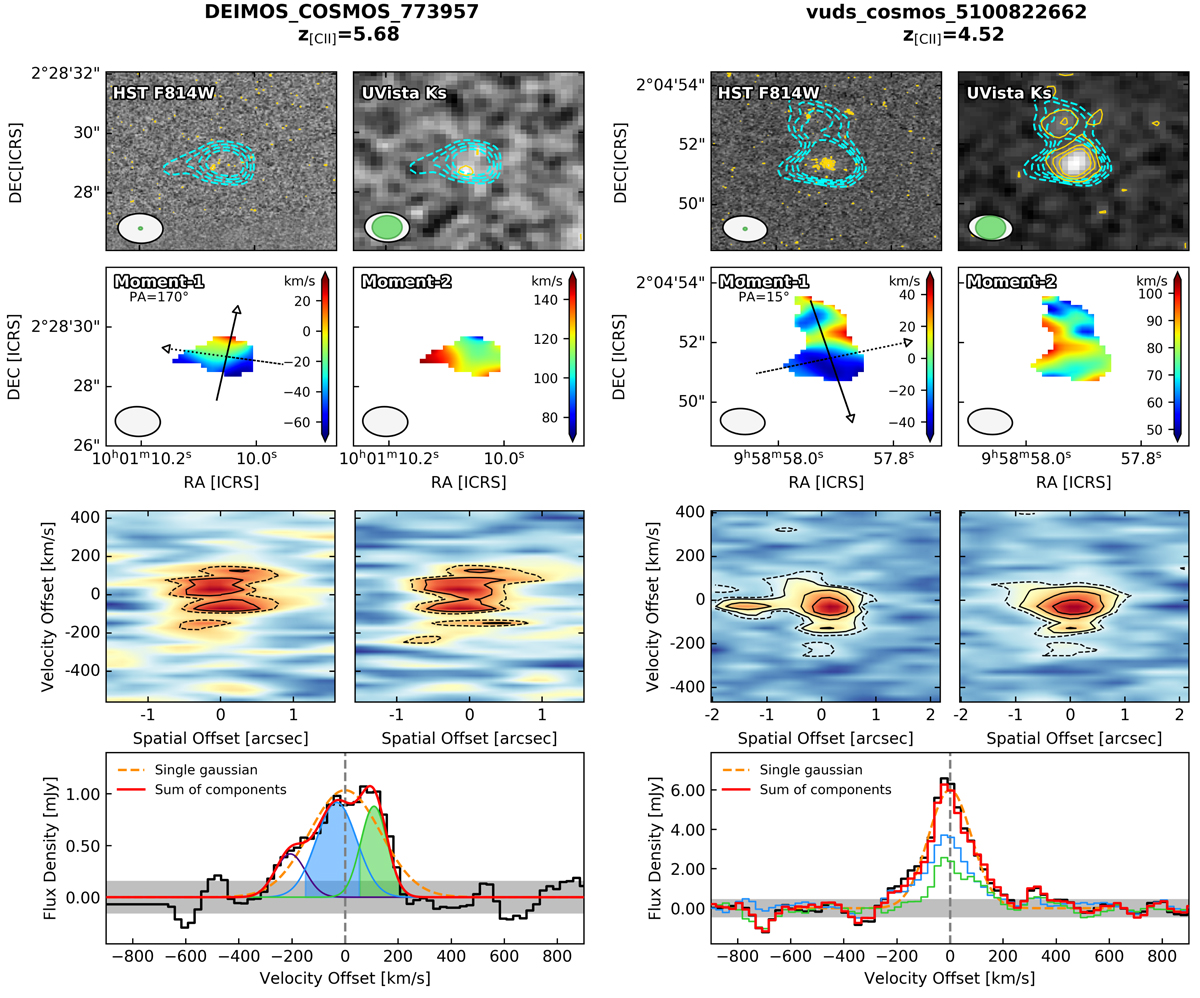
Fig. 1.
Download original image
Left: morpho-kinematic analysis of the ALPINE target DC_773957 at z[CII] = 5.68. First row: HST/ACS F814W (left) and UltraVISTA DR4 Ks-band (right) images centered on the UV rest-frame position of the target. Each cutout is 6″ × 6″ wide. The cyan contours show the [CII] ALMA emission starting from 3σ above the noise level. Yellow contours in the optical maps represent 3, 5 and 7σ emission. In the lower left corner, the ALMA beam (white) and HST or UltraVISTA resolutions (green) are displayed. Second row: moment-1 (left) and moment-2 (right) maps color-coded for the velocity and velocity dispersion in km s−1. The velocity map reports the direction of the major (solid) and minor (dashed) axis (centered on the coordinates returned by the best-fit 2D Gaussian model on the moment-0 map) along which the PVDs are computed. Third row: PVDs along the major (left) and minor (right) axis color-coded for the flux intensity in each pixel. Dashed contours include the 2σ emission in the maps while 3, 5 and 7σ emission is represented by solid lines. Fourth row: [CII] spectrum (black histogram) extracted within the 3σ contours of the intensity map. The gray shaded band marks the 1σ level of the spectrum while the dashed vertical line shows the zero velocity offset computed with respect to the redshift of the [CII] line. Purple, blue, and green lines are three individual possible components of the merging system, resulting in the global profile in red. The shaded areas under the curves represent the channels used to compute the [CII] intensity maps of the corresponding individual components. A single Gaussian fit is also visible with a dashed-orange line. Right: morpho-kinematic analysis of the ALPINE target vc_5100822662 at z[CII] = 4.52. Same panels as in the left figure. In the bottom panel we report the [CII] spectra of the major (blue) and minor (green) merger components extracted at the positions of the two resolved emissions, as further described in the text.
Current usage metrics show cumulative count of Article Views (full-text article views including HTML views, PDF and ePub downloads, according to the available data) and Abstracts Views on Vision4Press platform.
Data correspond to usage on the plateform after 2015. The current usage metrics is available 48-96 hours after online publication and is updated daily on week days.
Initial download of the metrics may take a while.