Open Access
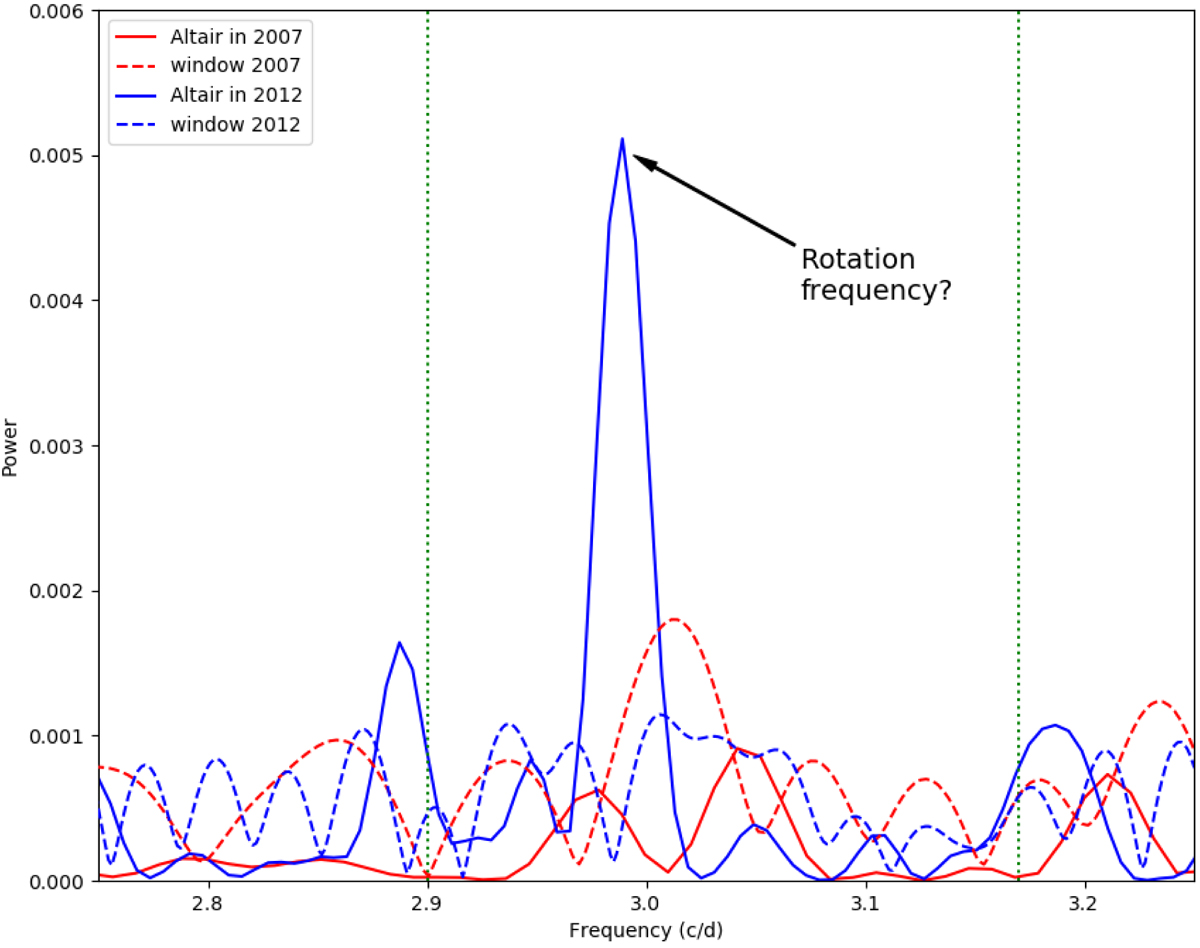
Fig. 9.
Download original image
Close-up of the spectrum near the expected rotation frequency. The two dotted vertical lines show the 2-sigma interval where the rotation could be found including the effects of surface differential rotation.
Current usage metrics show cumulative count of Article Views (full-text article views including HTML views, PDF and ePub downloads, according to the available data) and Abstracts Views on Vision4Press platform.
Data correspond to usage on the plateform after 2015. The current usage metrics is available 48-96 hours after online publication and is updated daily on week days.
Initial download of the metrics may take a while.