Open Access
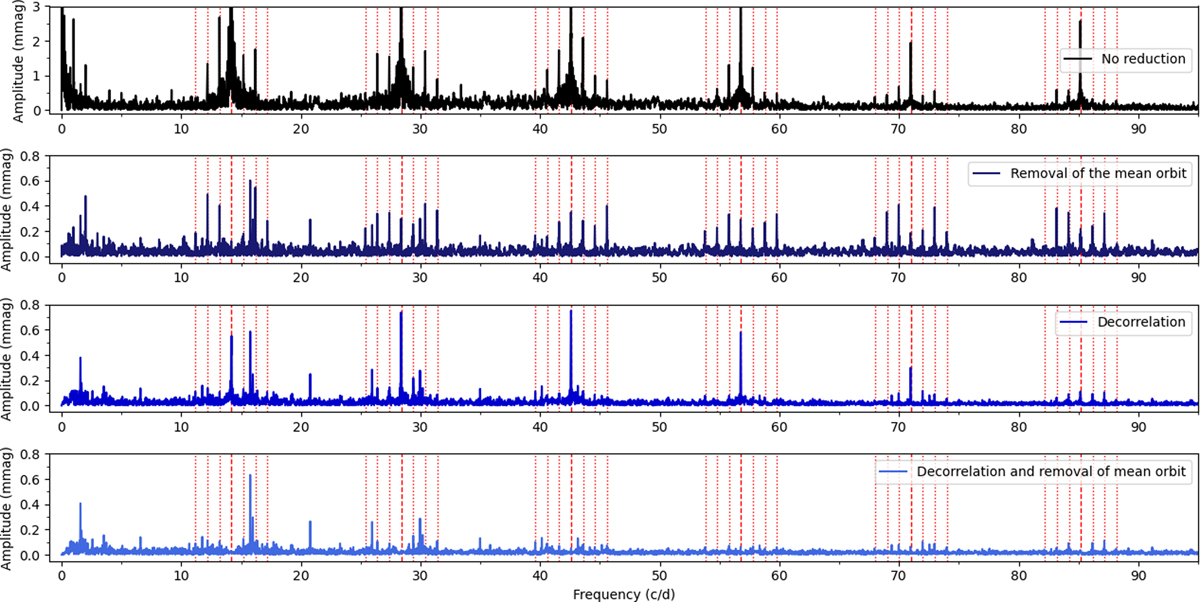
Fig. 4.
Download original image
Effects of different reduction techniques on the amplitude spectrum for the 2012 set. The dashed red lines show the orbital frequency and its harmonics. The red dotted lines are evenly spaced 1 c/d apart from one another.
Current usage metrics show cumulative count of Article Views (full-text article views including HTML views, PDF and ePub downloads, according to the available data) and Abstracts Views on Vision4Press platform.
Data correspond to usage on the plateform after 2015. The current usage metrics is available 48-96 hours after online publication and is updated daily on week days.
Initial download of the metrics may take a while.