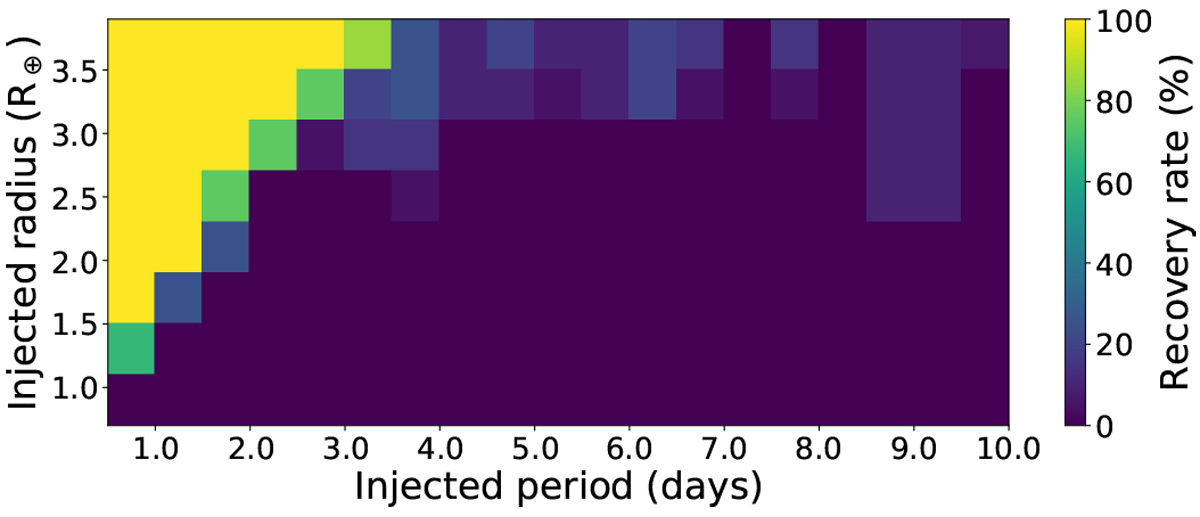
Fig. 7
Download original image
Injection-and-recovery tests performed to check the detectability of extra planets in the system. We explored atotal of 663 different scenarios and five different phases each for a total of 3315 simulations. Then, each pixel evaluated about 20 scenarios, that is, 20 light curves with injected planets having different Pplanet, Rplanet, and T0. Larger recovery rates are presented in yellow and green colours, while lower recovery rates are shown in blue and darker hues. Planets smaller than 1.5 R⊕ would remain undetected for the full set of periods explored.
Current usage metrics show cumulative count of Article Views (full-text article views including HTML views, PDF and ePub downloads, according to the available data) and Abstracts Views on Vision4Press platform.
Data correspond to usage on the plateform after 2015. The current usage metrics is available 48-96 hours after online publication and is updated daily on week days.
Initial download of the metrics may take a while.