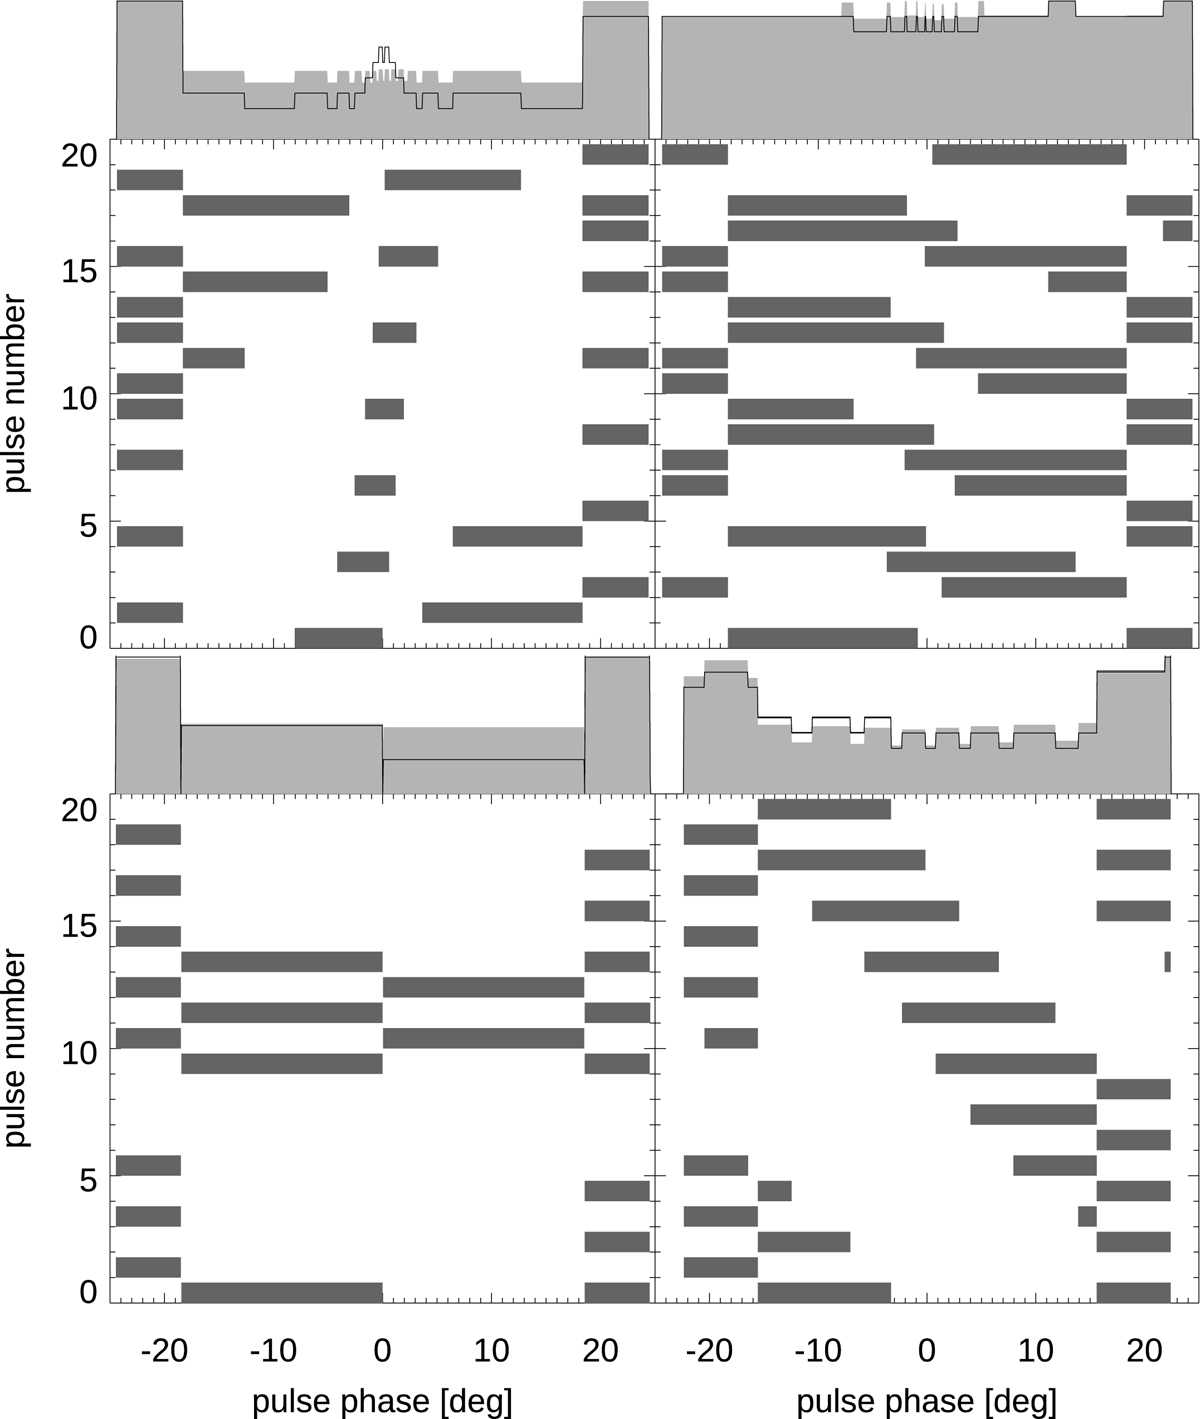
Fig. 4.
Download original image
Single pulses calculated for the beam types shown in grey at the top of Fig. 3. The figure shows several classical single pulse effects: left-right-middle modulation with core pulses (top left), jump by half of the modulation phase, with sporadic nulls in pulses 2 and 19 (top right), pulsation mode change at intermodal nulling (bottom left), and interior drift of sub-pulses flanked by fixed-longitude flux modulations (bottom right). The corresponding partial profiles are shown on top with a line and the average profiles for 2000 pulses in grey. Parameter values are (from left to right, top to bottom) Pd = 2.9, 4.2, 2.8, 1.9, β′= − 0.1, 0.1, 0, 0.4, ![]() everywhere,
everywhere, ![]() everywhere, and
everywhere, and ![]() , except for the top right, where
, except for the top right, where ![]() ; thus, only the top-right panel is for the symmetric beam (Fig. 3, top right).
; thus, only the top-right panel is for the symmetric beam (Fig. 3, top right).
Current usage metrics show cumulative count of Article Views (full-text article views including HTML views, PDF and ePub downloads, according to the available data) and Abstracts Views on Vision4Press platform.
Data correspond to usage on the plateform after 2015. The current usage metrics is available 48-96 hours after online publication and is updated daily on week days.
Initial download of the metrics may take a while.