Fig. 4
Download original image
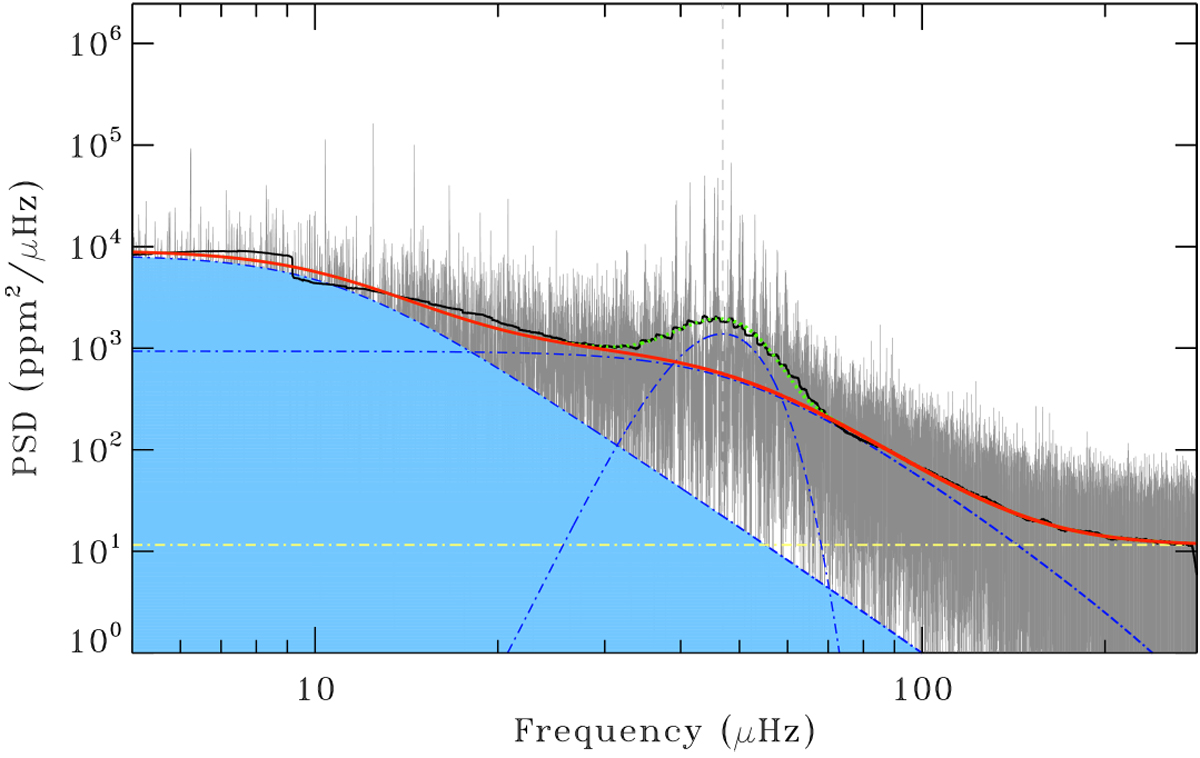
Power spectrum of KOI-3886. The power spectrum is shown in gray (with a heavily smoothed version in black). The solid red curve indicates a fit to the background done with DIAMONDS (Corsaro & De Ridder 2014), consisting of two Harvey-like profiles (dot-dashed blue curves) plus white noise (horizontal dot-dashed yellow line). A joint fit to the oscillation power excess (dot-dashed blue Gaussian curve) and background is visible at ~ 50 μHz as a dotted green curve.
Current usage metrics show cumulative count of Article Views (full-text article views including HTML views, PDF and ePub downloads, according to the available data) and Abstracts Views on Vision4Press platform.
Data correspond to usage on the plateform after 2015. The current usage metrics is available 48-96 hours after online publication and is updated daily on week days.
Initial download of the metrics may take a while.