Fig. B.3
Download original image
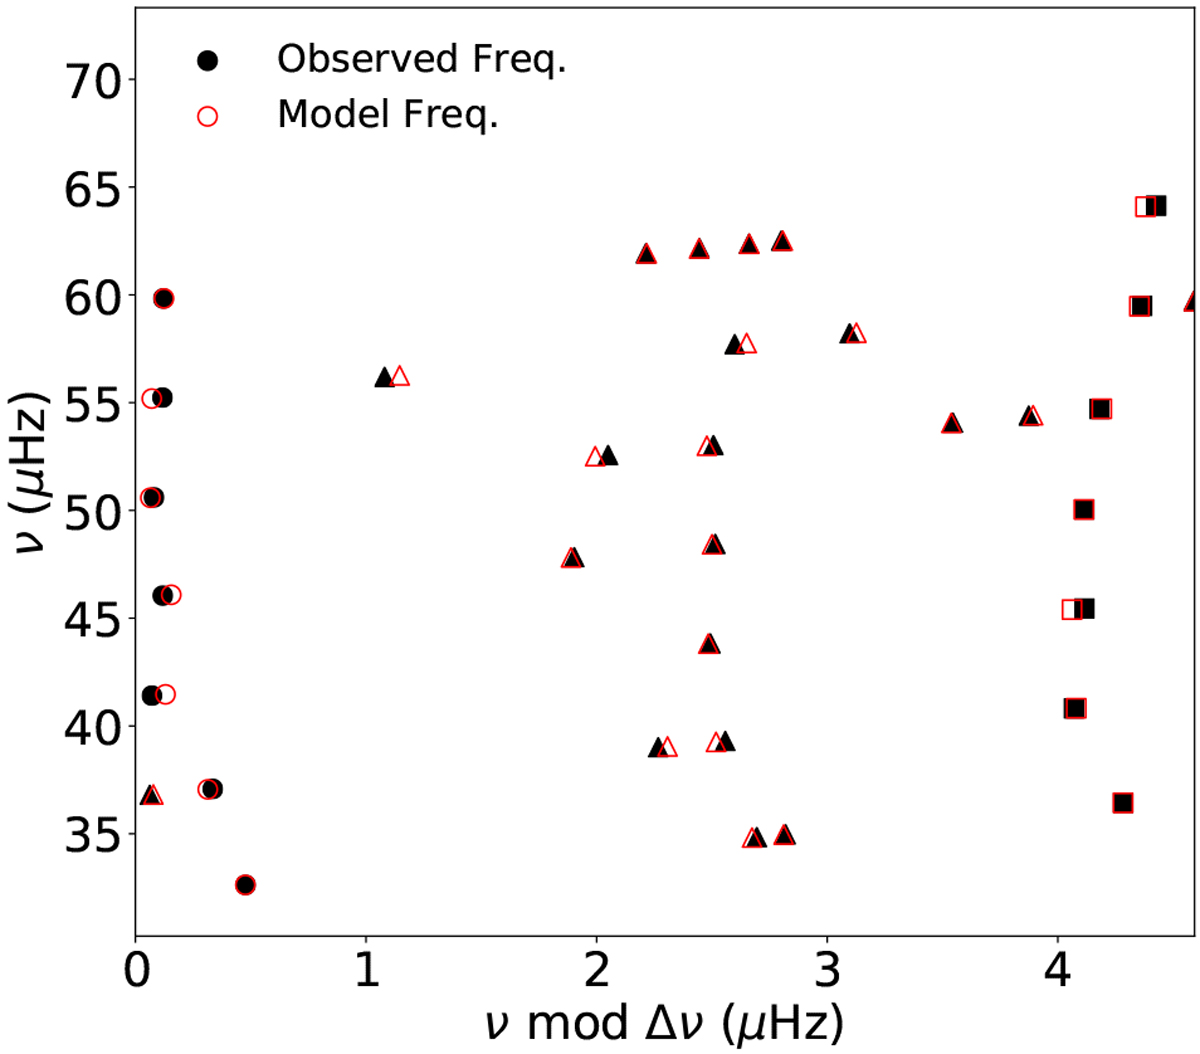
Échelle diagram representing the observed frequencies (filled black symbols) as well as the model frequencies (open red symbols) corresponding to a representative best-fitting model. No interpolation was used and so this correspondsto a specific model in the grid. The circles, triangles, and squares indicate the modes of angular degree ℓ = 0 (radial modes), ℓ = 1 (dipole modes), and ℓ = 2 (quadrupolemodes), respectively.
Current usage metrics show cumulative count of Article Views (full-text article views including HTML views, PDF and ePub downloads, according to the available data) and Abstracts Views on Vision4Press platform.
Data correspond to usage on the plateform after 2015. The current usage metrics is available 48-96 hours after online publication and is updated daily on week days.
Initial download of the metrics may take a while.