Fig. B.2
Download original image
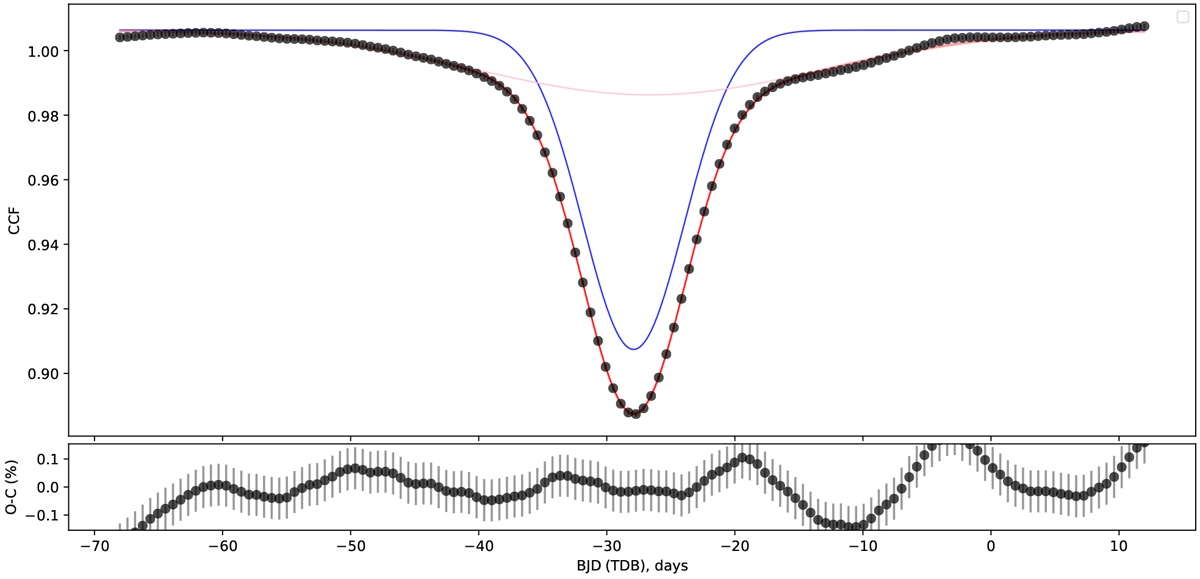
Example of the CCF of one of the HERMES spectra (black symbols). The two-component modeling of the CCF is shown as a red line, while the two individual components are shown in blue (sharp component, star A) and light pink (broad component, star B). Bottom panel: residuals after subtracting the two-component model to the CCF.
Current usage metrics show cumulative count of Article Views (full-text article views including HTML views, PDF and ePub downloads, according to the available data) and Abstracts Views on Vision4Press platform.
Data correspond to usage on the plateform after 2015. The current usage metrics is available 48-96 hours after online publication and is updated daily on week days.
Initial download of the metrics may take a while.