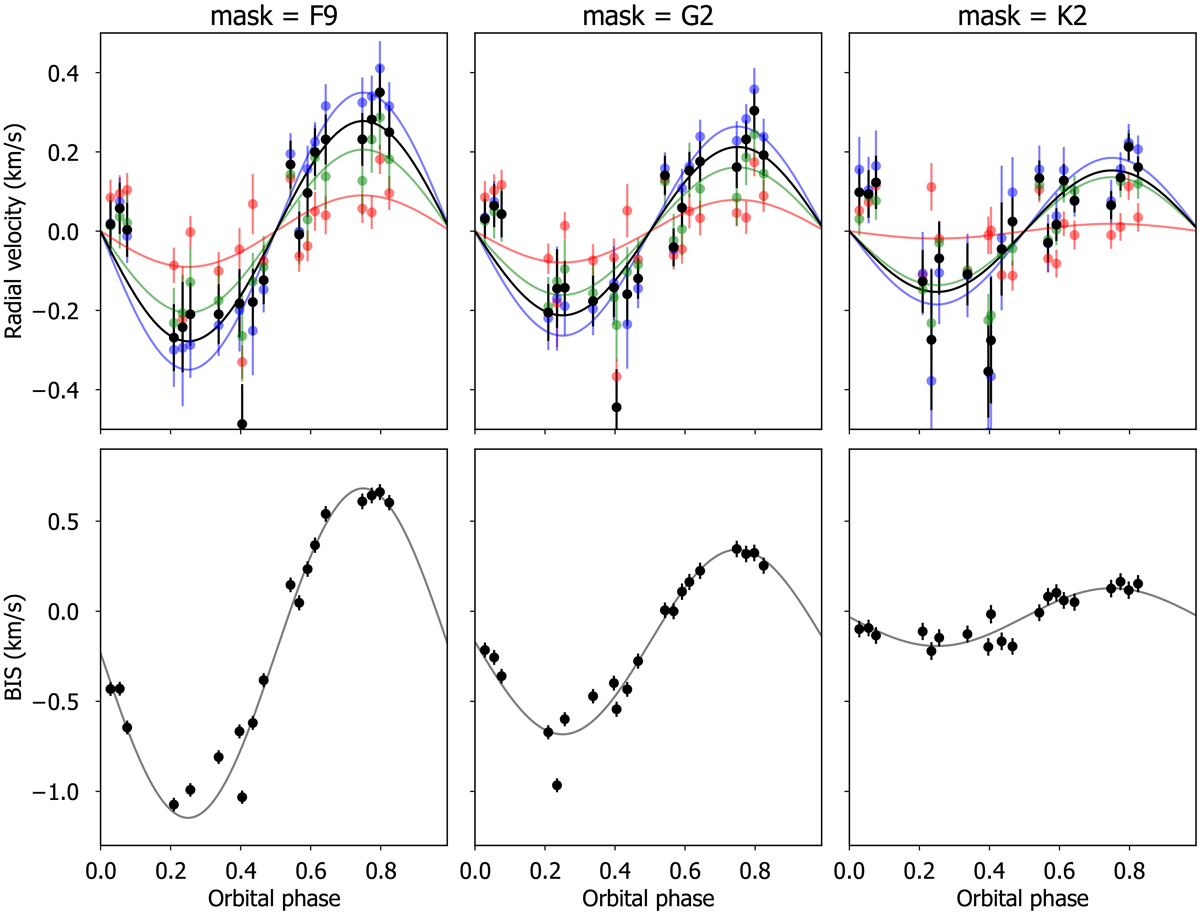
Fig. B.1
Download original image
Inferred RV (top panels) and bisector span (bottom panels) for different binary masks (F9, G2, and K2 from left to right panels). In the top panels, the different colors show the RVs estimated with three different wavelength ranges: blue (3800–5100 Å), green (5100–6400 Å), and red (6400–7800 Å). A simple maximum-likelihood model fit to the corresponding dataset is shown with solid lines. All panels are phase-folded with the Kepler eclipse periodicity.
Current usage metrics show cumulative count of Article Views (full-text article views including HTML views, PDF and ePub downloads, according to the available data) and Abstracts Views on Vision4Press platform.
Data correspond to usage on the plateform after 2015. The current usage metrics is available 48-96 hours after online publication and is updated daily on week days.
Initial download of the metrics may take a while.