Fig. 14
Download original image
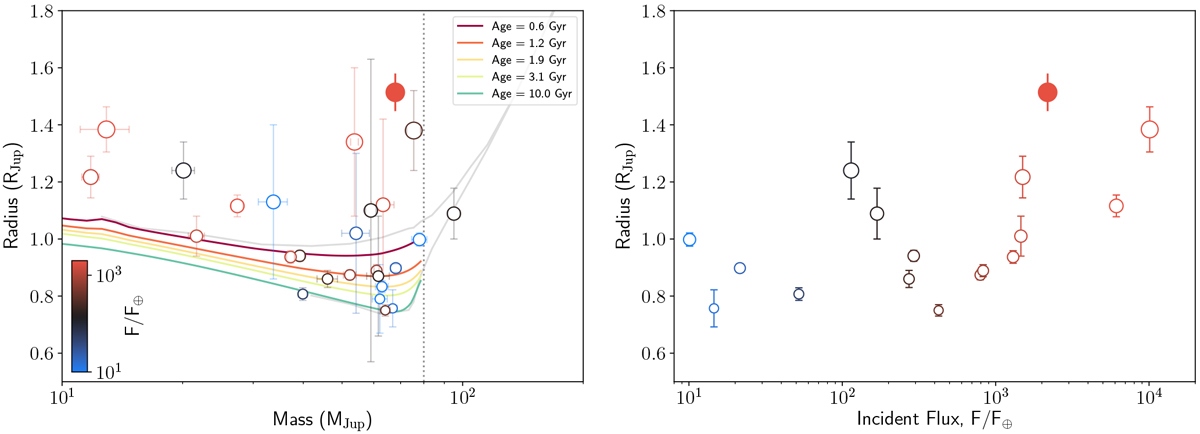
Left panel: mass-radius diagram in the brown dwarf regime for all known eclipsing brown dwarfs (open symbols) from Carmichael et al. (2020) (and references there in) and the latest discoveries of TOI-503 (Šubjak et al. 2020), NGTS-7A (Jackman et al. 2019), and TOI-263 (Parviainen et al. 2020; Palle et al. 2021). KOI-3886 C is represented by the filledsymbol. The color code indicates the incident flux from their primary star in units of Earth’s flux received from the Sun. Isochrones for different ages from Phillips et al. (2020) are shown in colors, while the stellar tracks from Baraffe et al. (2015) for 1 and 12 Gyr are shown in gray. The dashed vertical line marks the hydrogen burning limit between stars and brown dwarfs. Right panel: radius vs. incident flux of the same sample of brown dwarfs as in the left panel, showing the increasing evidence of irradiation as the source of inflation for these objects.
Current usage metrics show cumulative count of Article Views (full-text article views including HTML views, PDF and ePub downloads, according to the available data) and Abstracts Views on Vision4Press platform.
Data correspond to usage on the plateform after 2015. The current usage metrics is available 48-96 hours after online publication and is updated daily on week days.
Initial download of the metrics may take a while.