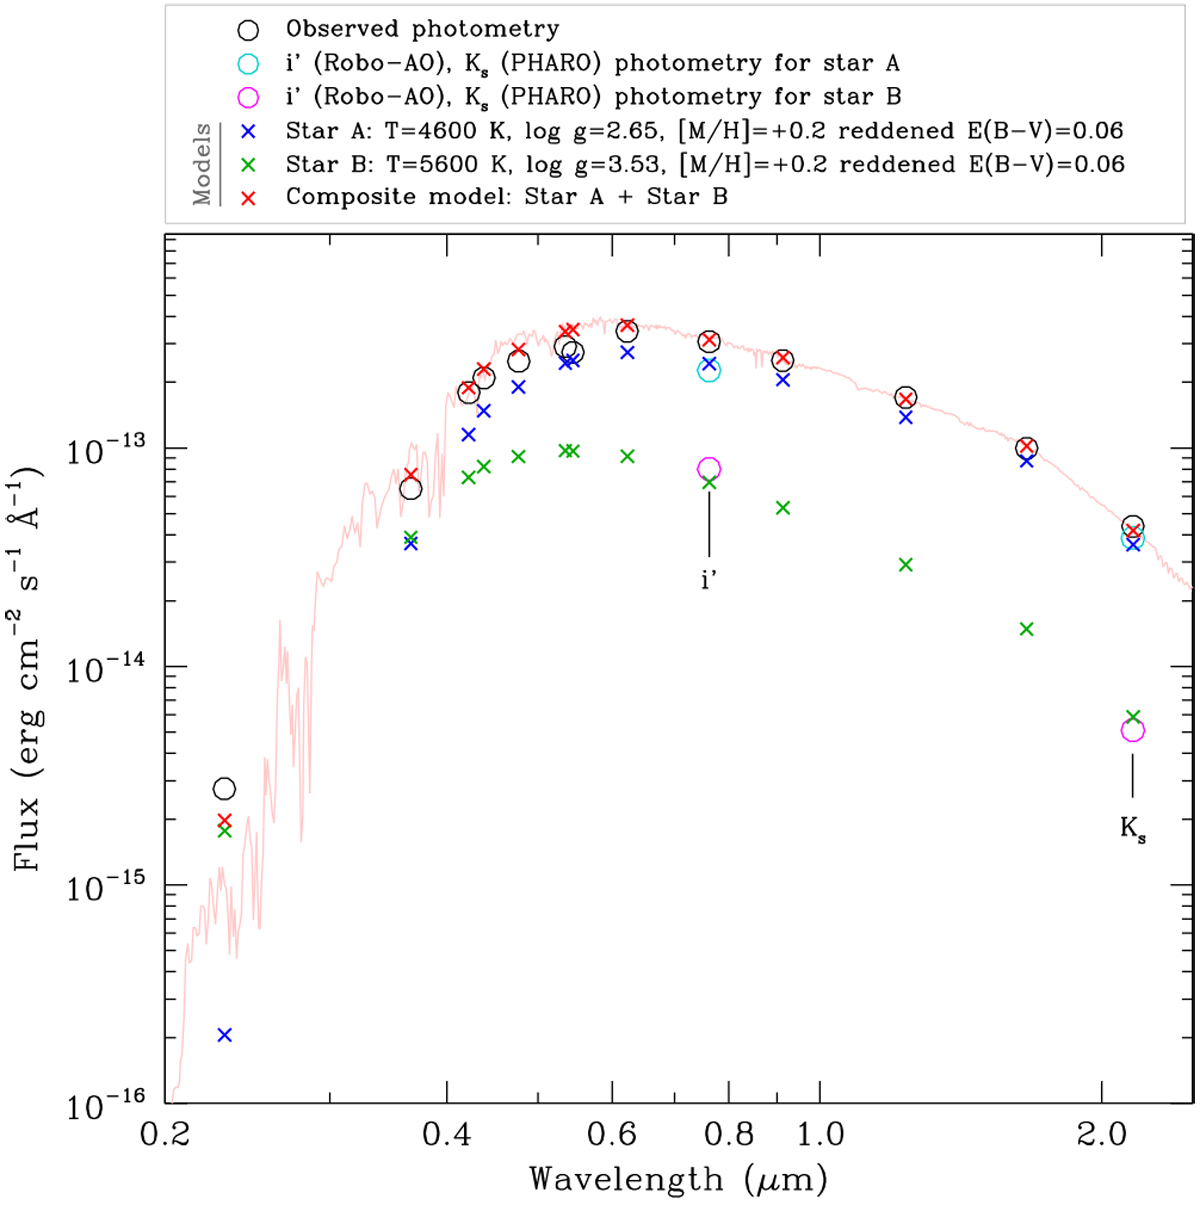
Fig. 10
Download original image
Final result of the iterative process fitting the SED. The observed photometry is plotted as empty black circles, empty cyan and purple circles represent the fluxes at i′ Ks for stars A and B, respectively. The synthetic photometry on the models for stars A and B and the composite – final – model are plotted as blue, green, and red crosses. The composite model is also plotted in pale red.
Current usage metrics show cumulative count of Article Views (full-text article views including HTML views, PDF and ePub downloads, according to the available data) and Abstracts Views on Vision4Press platform.
Data correspond to usage on the plateform after 2015. The current usage metrics is available 48-96 hours after online publication and is updated daily on week days.
Initial download of the metrics may take a while.