Fig. B.1
Download original image
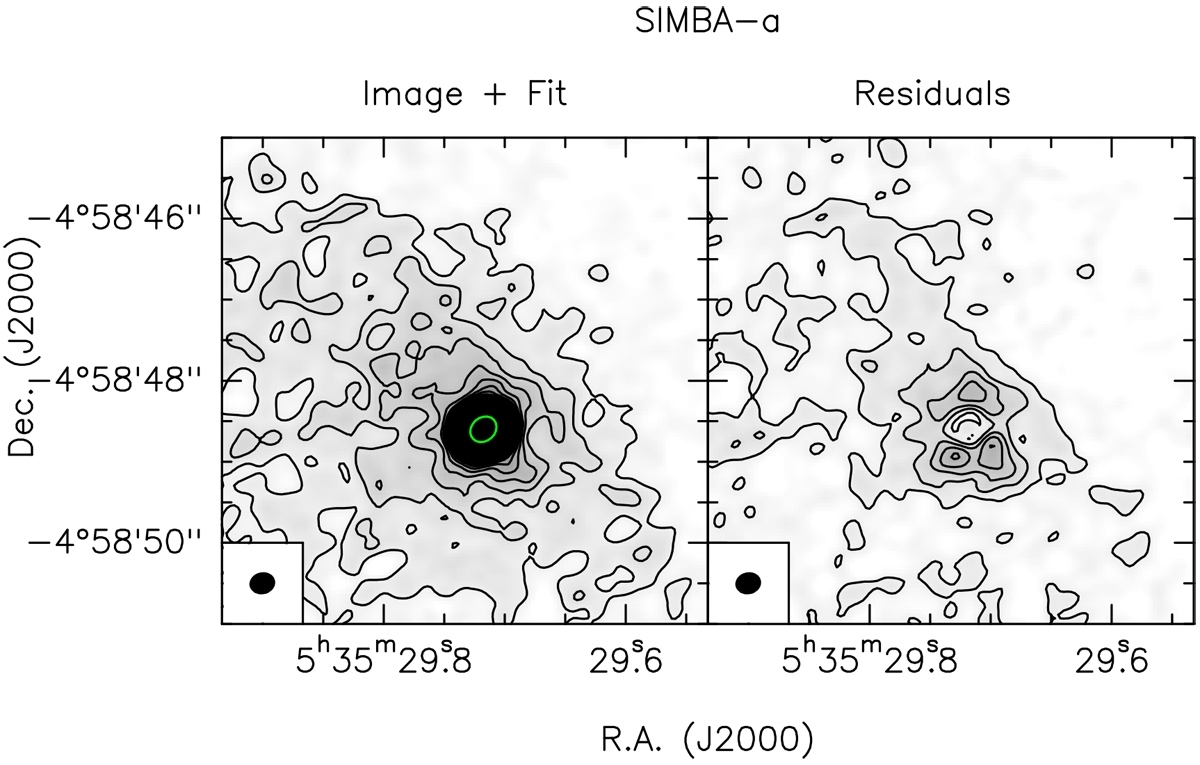
Example of a uv fit for SIMBA-a. Left: 246.2 GHz continuum map of SIMBA-a with contours starting from 5σ with steps every 5σ (see Table 1 for 1σ values). The source size derived from the fit and convolved by the beam is indicated by the green ellipse. Right: Image of the residuals of the uv fit. The synthesised beam is depicted in black in the lower left corner of each panel.
Current usage metrics show cumulative count of Article Views (full-text article views including HTML views, PDF and ePub downloads, according to the available data) and Abstracts Views on Vision4Press platform.
Data correspond to usage on the plateform after 2015. The current usage metrics is available 48-96 hours after online publication and is updated daily on week days.
Initial download of the metrics may take a while.