Fig. 6
Download original image
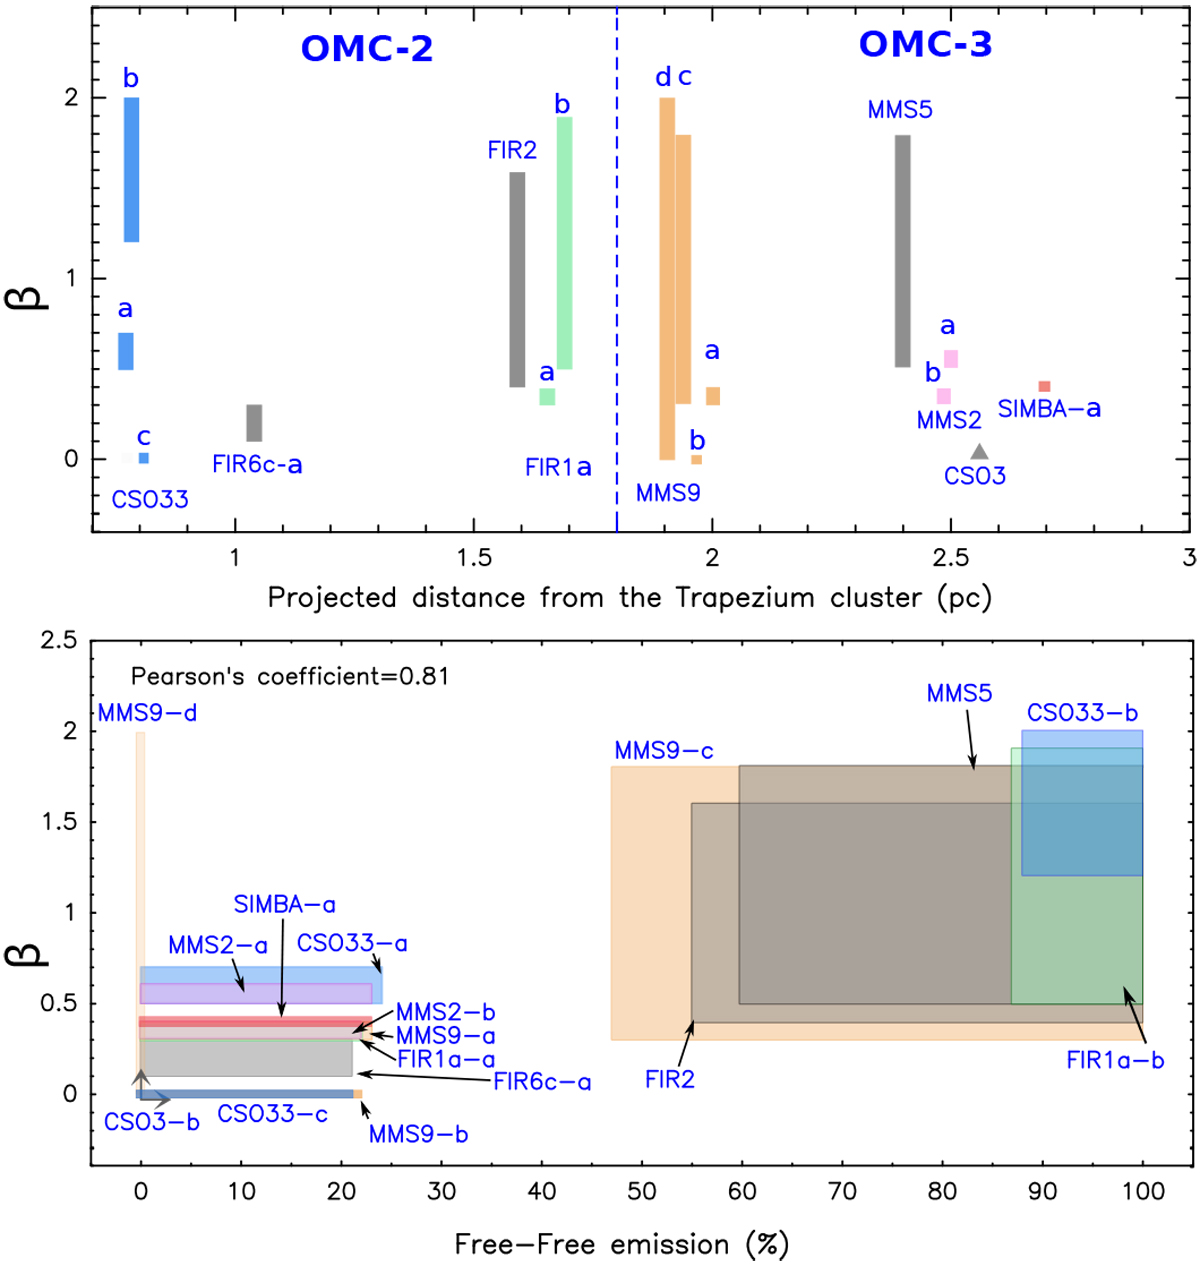
Main results obtained from the dust parameters derivation of the sources. Top: spectral emissivity index, β, for each source as a function of the position in the OMC-2/3 filament. The dashed blue line indicates the separation between the OMC-2 and OMC-3 clouds. Bottom: spectral emissivity index, β, as a function of the percentage of free-free emission derived for each source. In both panels, the grey filled rectangles and arrows represent the values of the parameters (β, free-free emission) associated with the bolometric and/or radiative temperatures of the corresponding source. For clarity, a colour is associated with each system (blue for CSO33, green for FIR1a, orange for MMS9, and pink for MMS2). The possible values for these sources are represented with their corresponding coloured area.
Current usage metrics show cumulative count of Article Views (full-text article views including HTML views, PDF and ePub downloads, according to the available data) and Abstracts Views on Vision4Press platform.
Data correspond to usage on the plateform after 2015. The current usage metrics is available 48-96 hours after online publication and is updated daily on week days.
Initial download of the metrics may take a while.