Fig. 5

Download original image
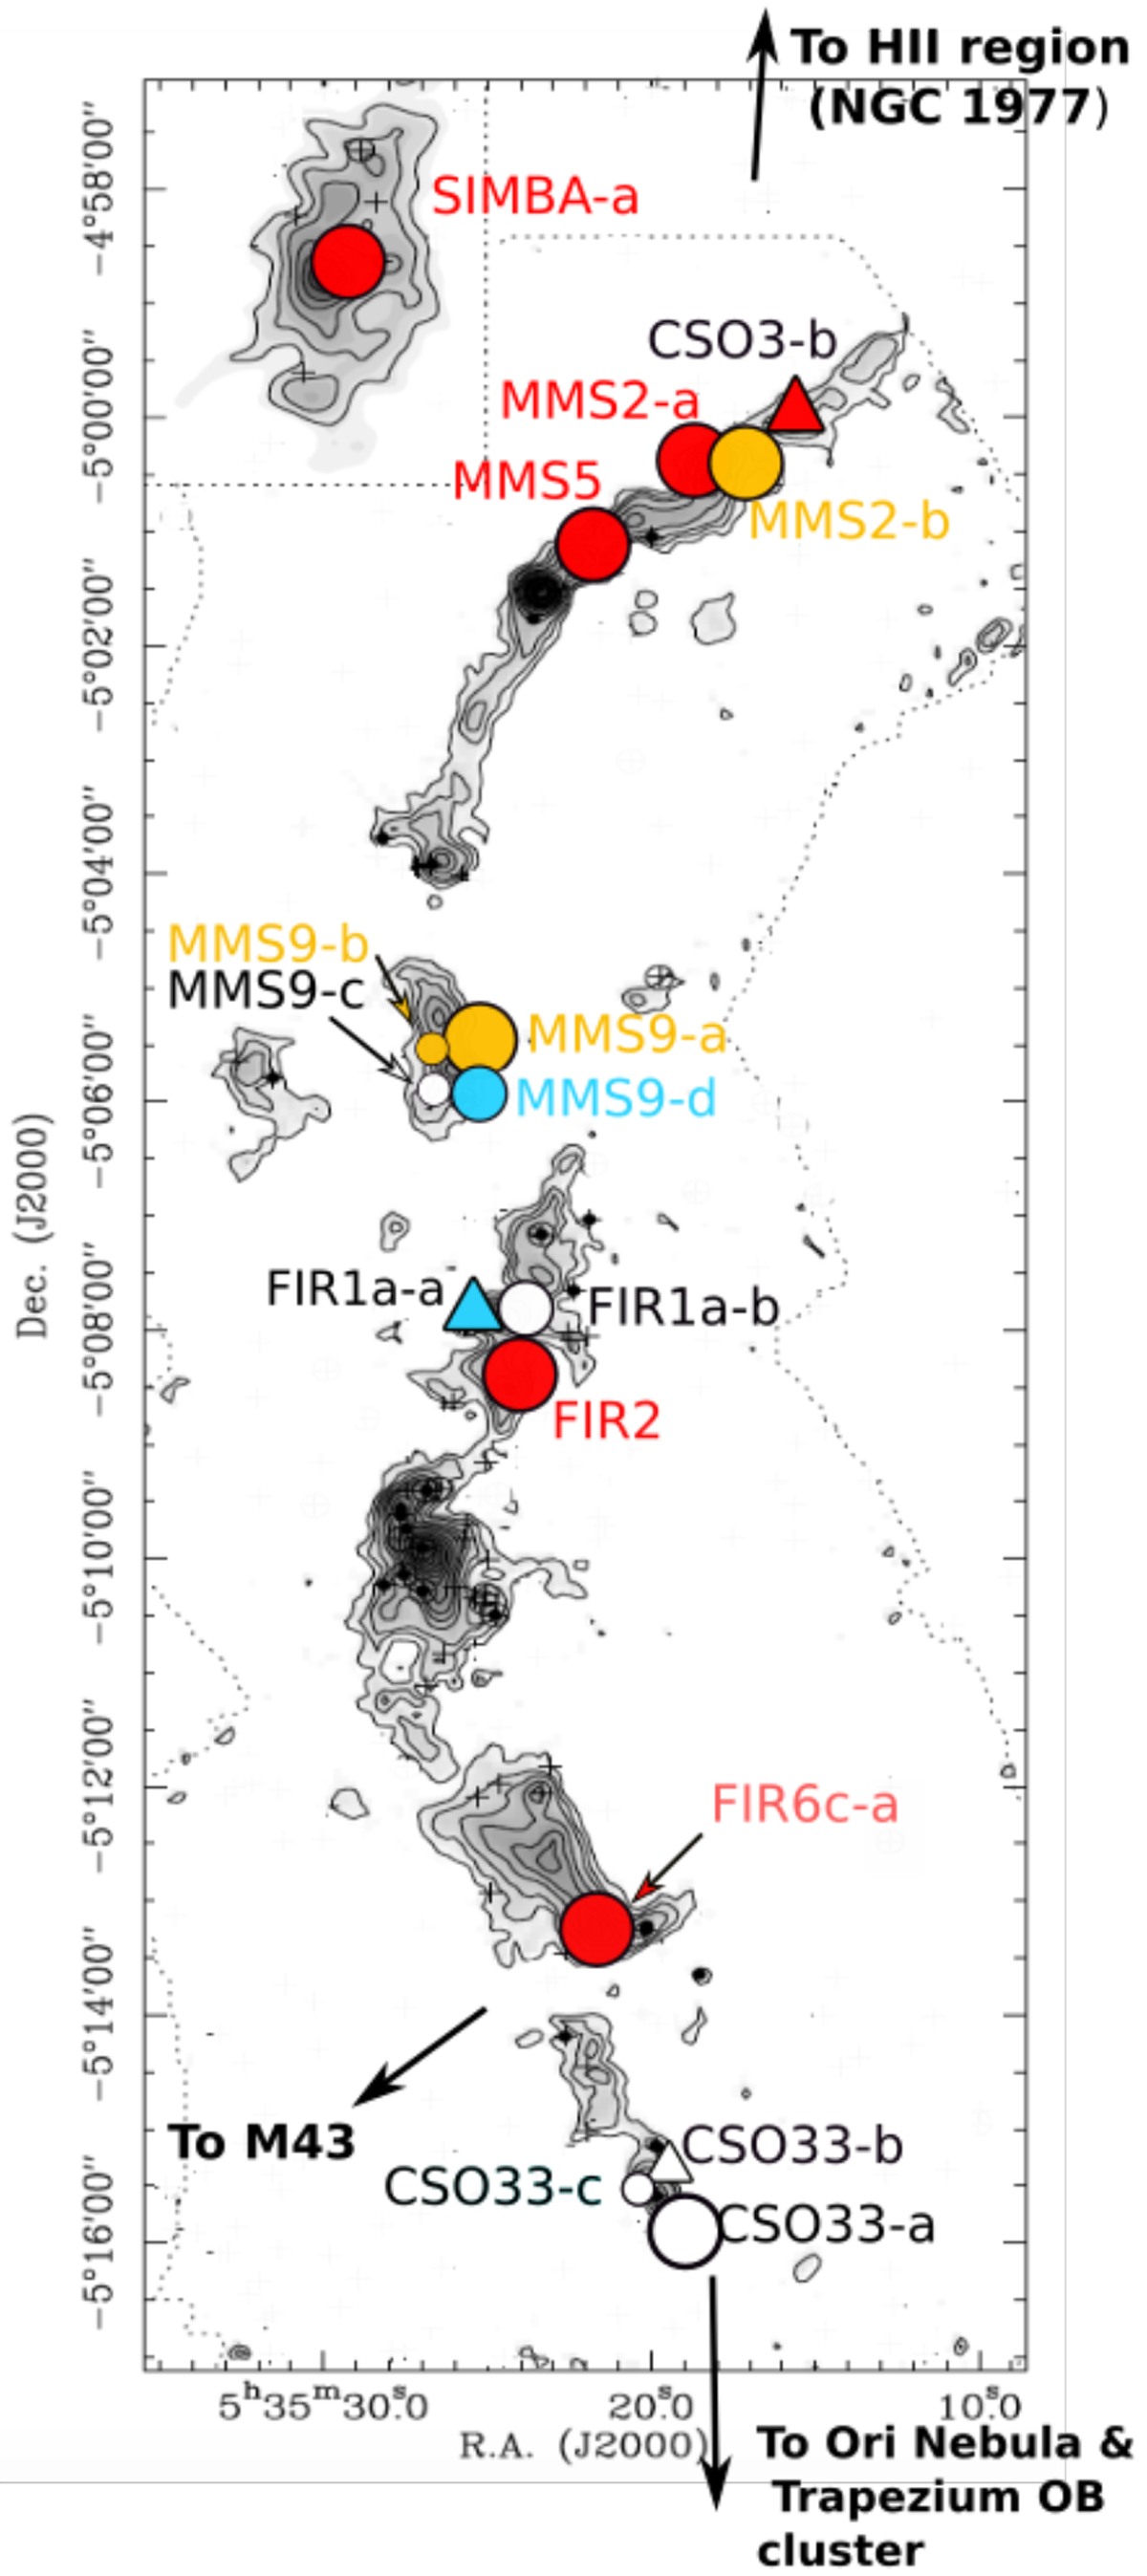
Map of the continuum at 246.2 GHz towards the OMC-2/3 filament, adapted from Chini et al. (1997) and Nielbock et al. (2003). The upper left insert (square grid) is taken from the SIMBA map of Nielbock et al. (2003). The dotted line indicates the limits of the continuum map at 1.3mm. Contours rise linearly from a 3σ rms noise level, the rms noise of the map being 25 mJy beam−1 (Chini et al. 1997). The sources from our sample are shown as coloured circles and triangles, colour-coded depending on the ranges of dust temperature derived in this work: blue means cold (Td < 50 K), yellow means warm (Td ≥ 50 K), red means hot (Td ≥ 90 K), and white means that the temperature is not constrained enough. The shapes of the symbols are organised from Menv+disk derived values: the smallest circles for sources with a range of values <0.01M⊙, the largest circles for sources with the highest range of values (≥0.01M⊙), medium circles for sources with an intermediate range of values, and triangles for lower limits. The three black arrows pointing outside of the filament show the direction to the different HII regions surrounding OMC-2/3. Some black crosses and filled dots are present throughout the figure, and represent some of the 2MASS sources and MIR sources from TIMMI 2 observed by Nielbock et al. (2003).
Current usage metrics show cumulative count of Article Views (full-text article views including HTML views, PDF and ePub downloads, according to the available data) and Abstracts Views on Vision4Press platform.
Data correspond to usage on the plateform after 2015. The current usage metrics is available 48-96 hours after online publication and is updated daily on week days.
Initial download of the metrics may take a while.


