Fig. 4
Download original image
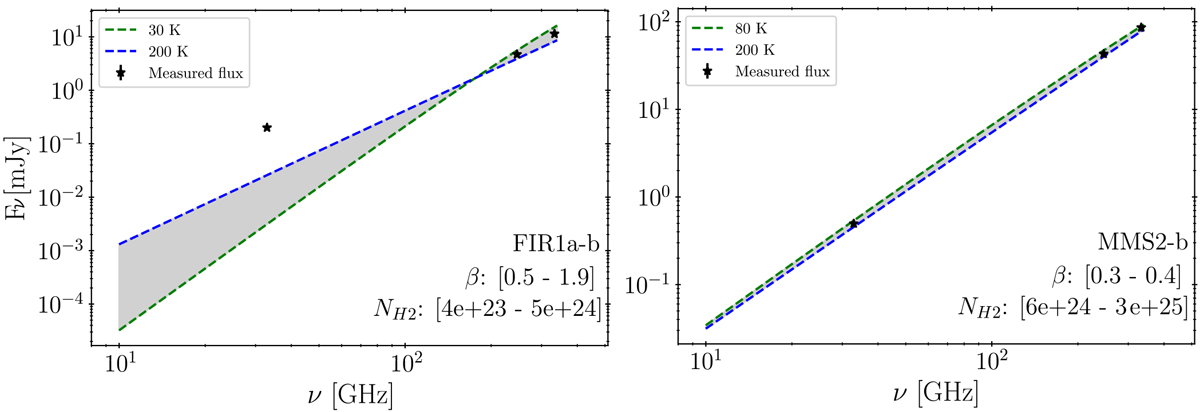
Example of dust SEDs obtained for two sources, FIR1a-b (left) and MMS2-b (right). The dust SEDs, calculated for the corresponding dust temperature range of each source and from the final parameters derived for each source (β, NH2, are shown by the grey shaded area. These parameters are indicated on the lower right side of the plot. Measured flux densities are represented by black filled stars. The dust SEDs corresponding to the two extreme values of the dust temperaturerange are represented by the blue and green dashed lines.
Current usage metrics show cumulative count of Article Views (full-text article views including HTML views, PDF and ePub downloads, according to the available data) and Abstracts Views on Vision4Press platform.
Data correspond to usage on the plateform after 2015. The current usage metrics is available 48-96 hours after online publication and is updated daily on week days.
Initial download of the metrics may take a while.