Fig. 3
Download original image
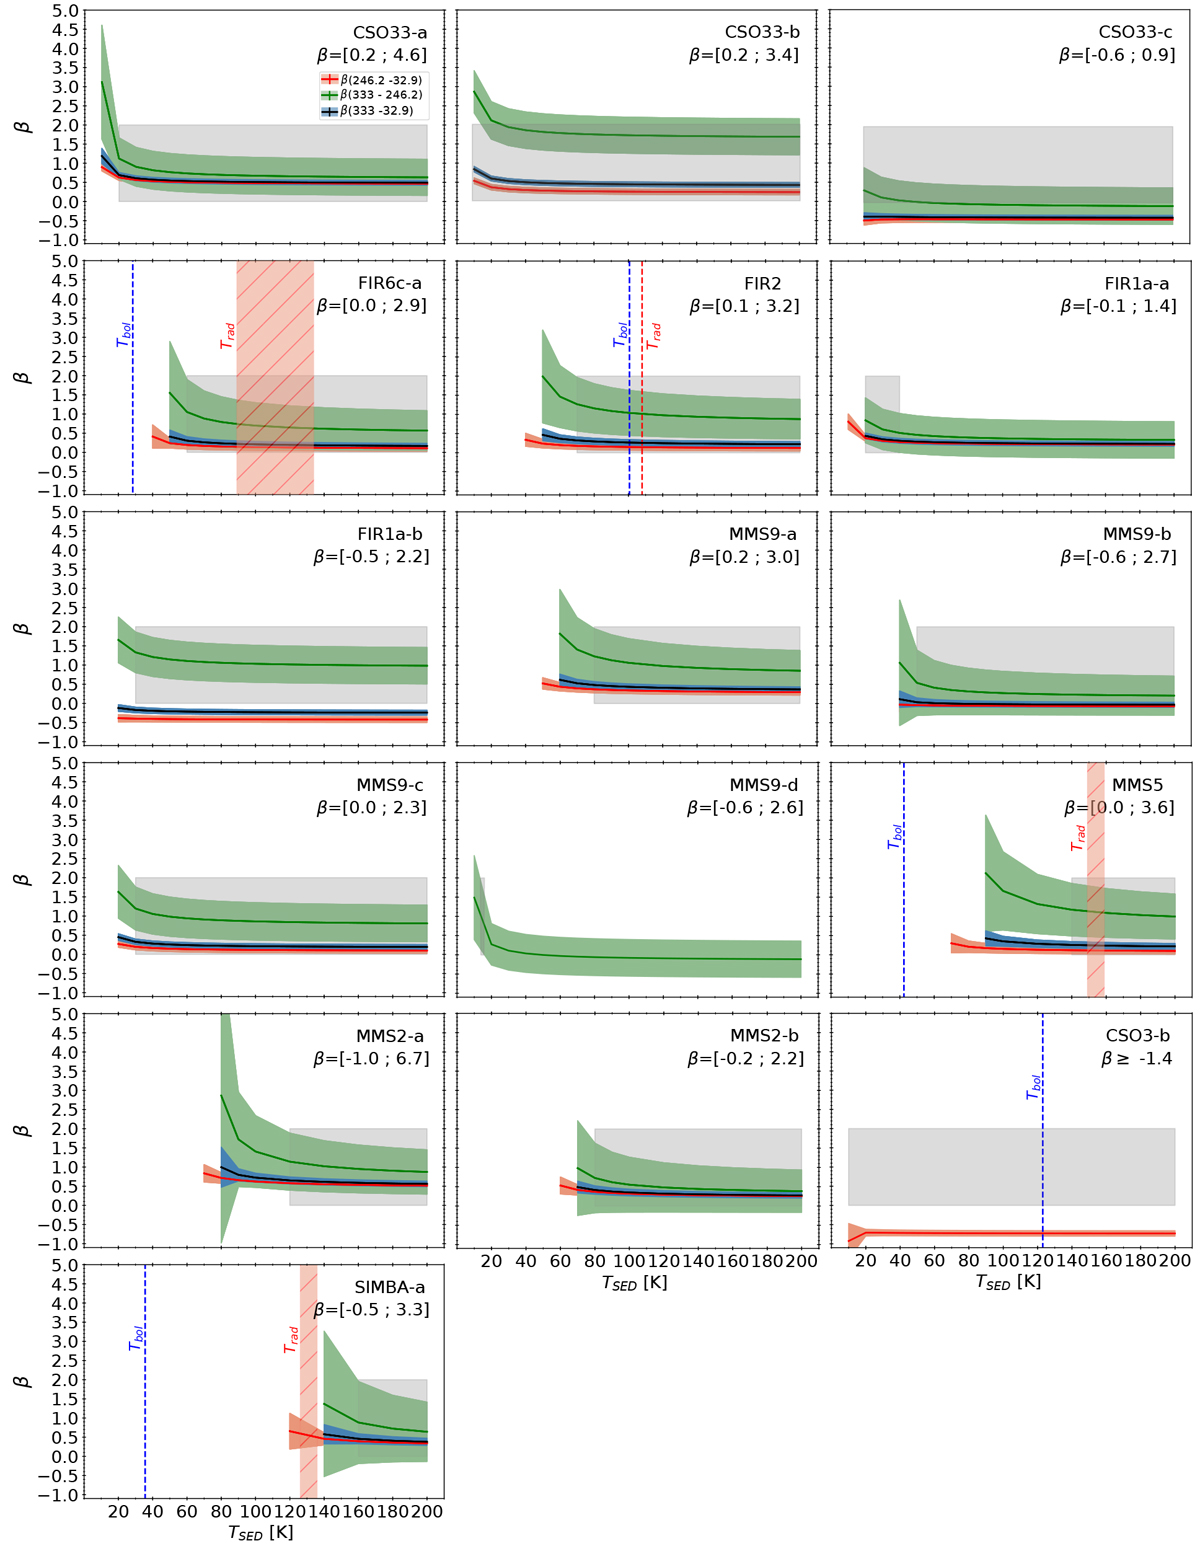
Dust emissivity spectral indexes, β, as a function of the SED temperature for each source. The indexes were derived between 333 GHz and 32.9 GHz (black lines), 333 GHz and 246.2 GHz (green lines), and 246.2 GHz and 32.9 GHz (red lines). The shaded grey area indicates the authorised range of β values (0–2) provided by theoretical works (see Sect. 2). Applying these limits on β constrains the possible range of TSED values. For each source, the minimum and maximum values of β derived over the full temperature range are indicated at the top right of the plots. For single systems, the bolometric temperature, Tbol, derived fromHerschel (Furlan et al. 2016), and the radiative temperature, Trad, are indicated by a vertical blue dashed line and red shaded area, respectively.
Current usage metrics show cumulative count of Article Views (full-text article views including HTML views, PDF and ePub downloads, according to the available data) and Abstracts Views on Vision4Press platform.
Data correspond to usage on the plateform after 2015. The current usage metrics is available 48-96 hours after online publication and is updated daily on week days.
Initial download of the metrics may take a while.