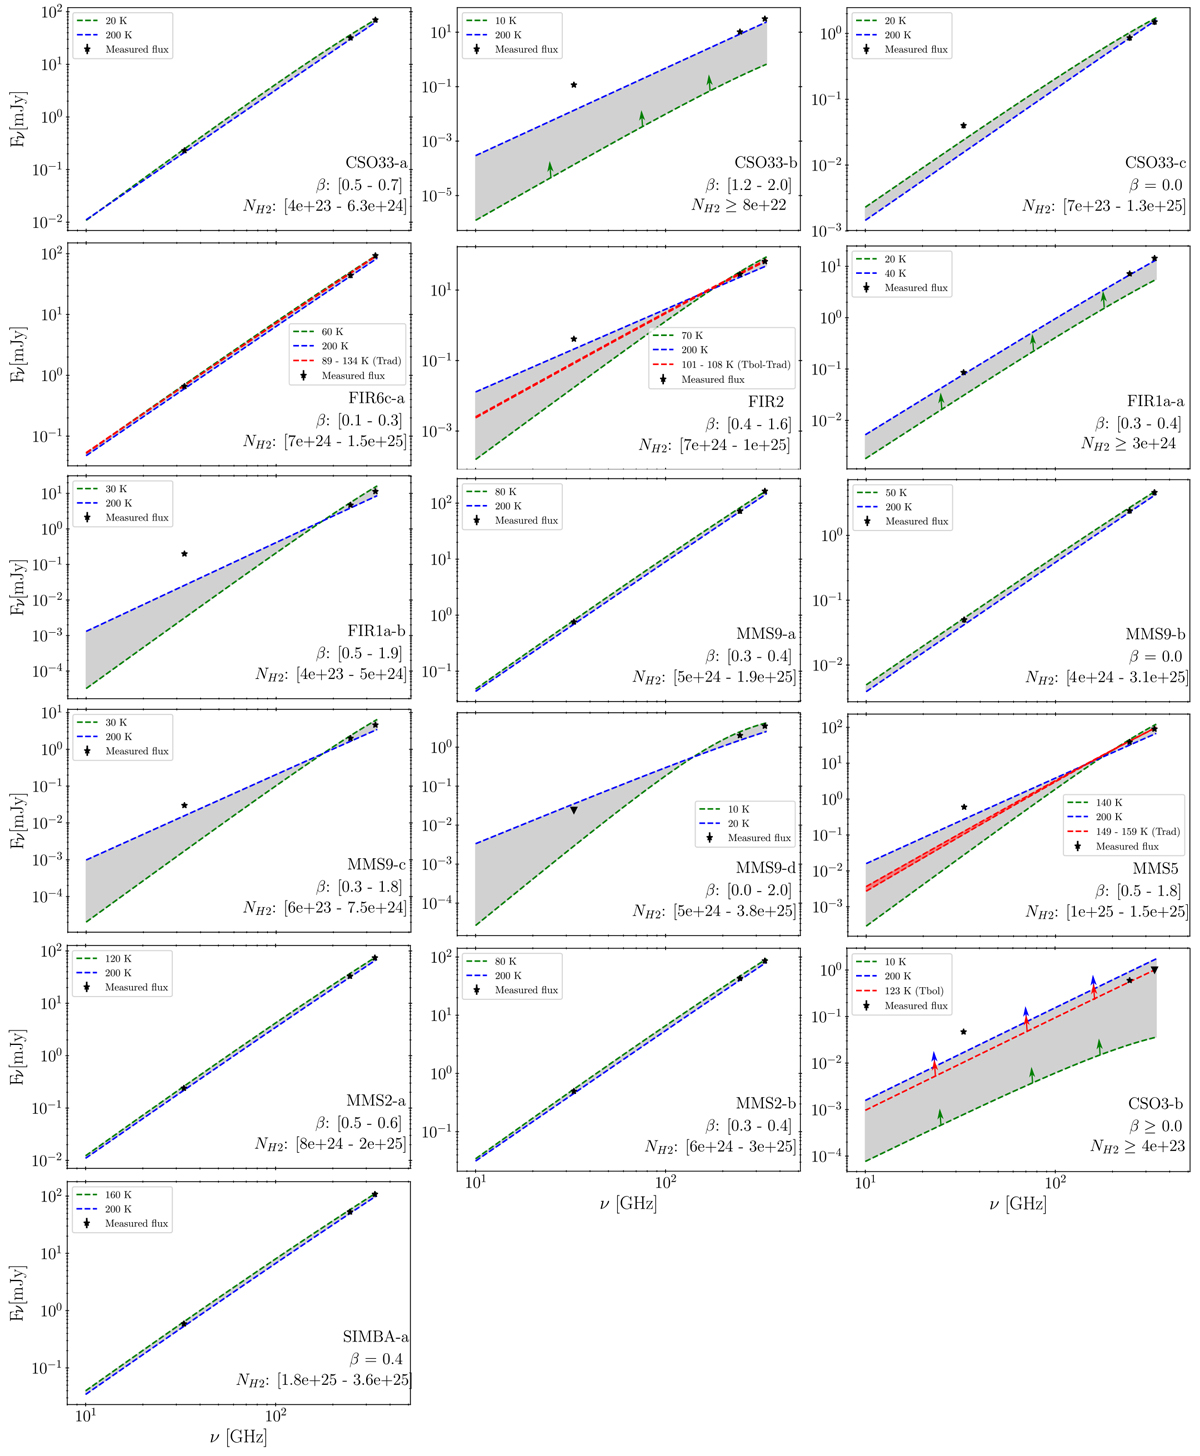
Fig. C.5
Download original image
Dust SED obtained for each source from the derived dust temperatures; dust emissivity spectral indexes, β; and H2 column density, NH2. For each source the dust SED of the two extreme values for the corresponding dust temperature range are indicated by blue and green dashed lines. The possible dust SEDs corresponding to the intermediate values of dust temperatures are represented by the grey shaded area. For FIR6c-a, FIR2, MMS5, and CSO3-b the dust SEDs corresponding to the derived range of Trad and/or Tbol are also represented by red dashed lines and a red shaded area. Measured flux densities are represented by black stars. Lower limitsare represented by coloured arrows.
Current usage metrics show cumulative count of Article Views (full-text article views including HTML views, PDF and ePub downloads, according to the available data) and Abstracts Views on Vision4Press platform.
Data correspond to usage on the plateform after 2015. The current usage metrics is available 48-96 hours after online publication and is updated daily on week days.
Initial download of the metrics may take a while.