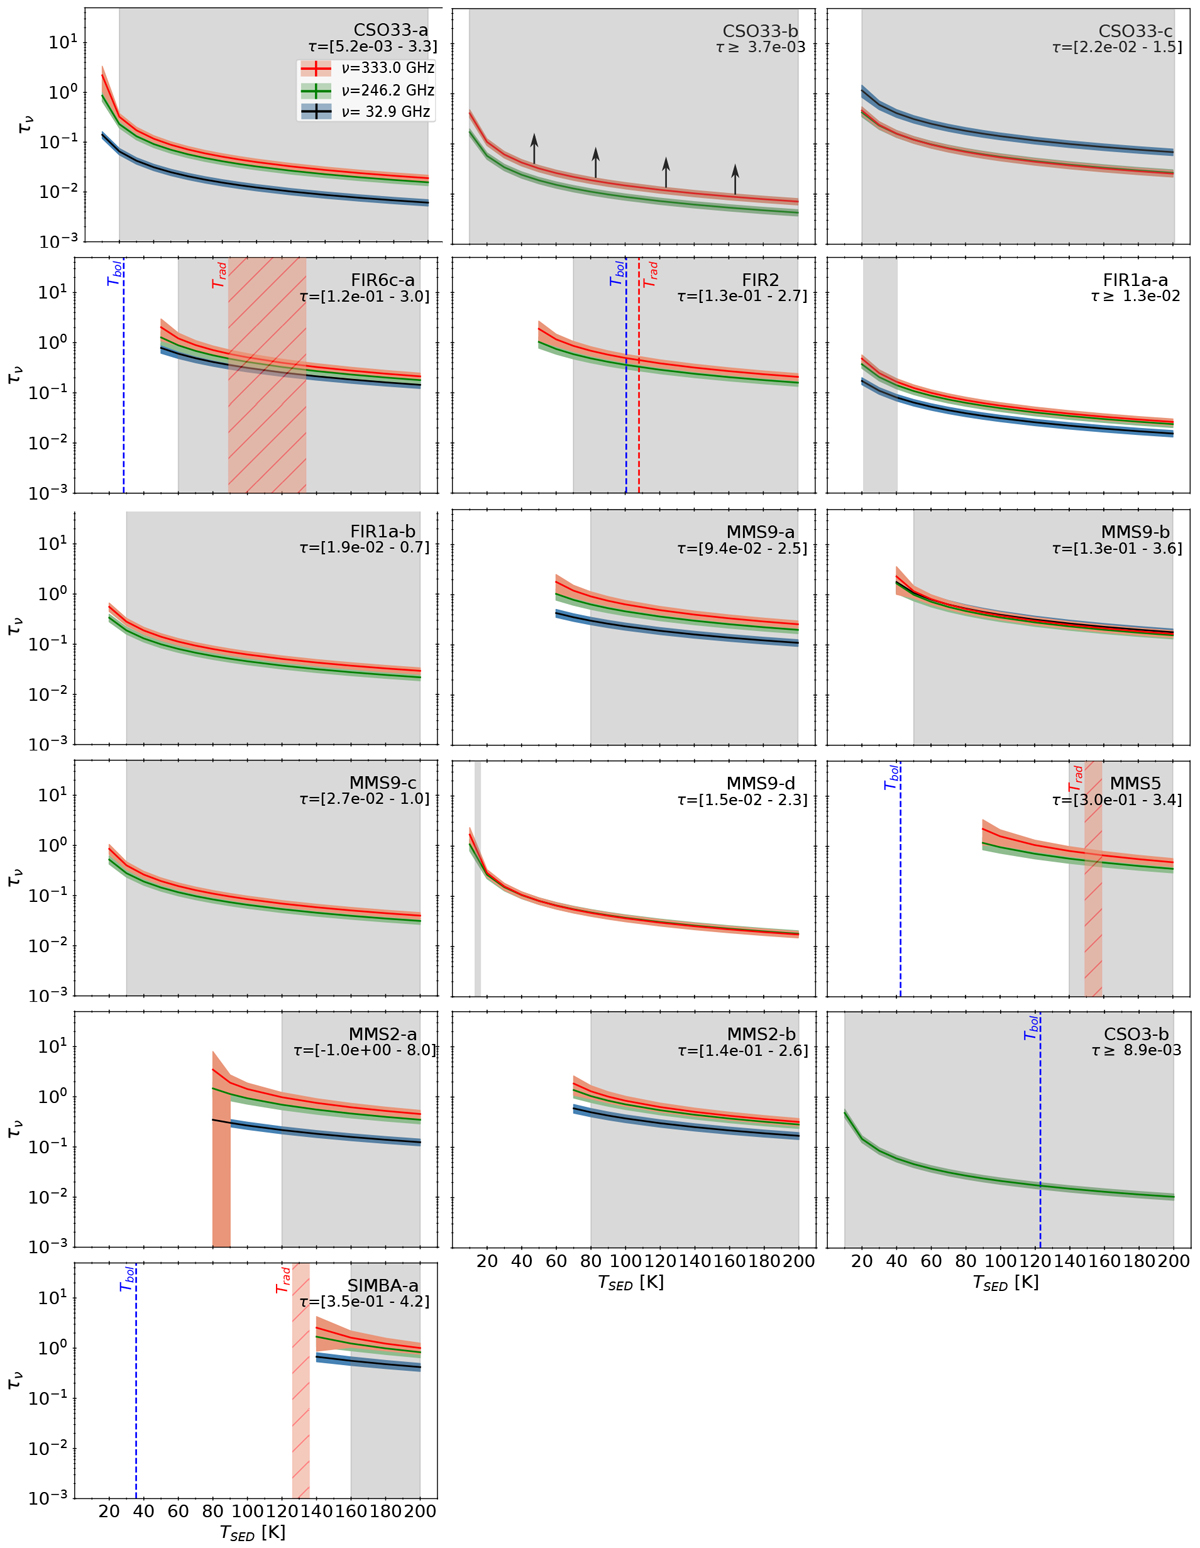
Fig. C.2
Download original image
Dust optical depths, τν, as a function of the SED temperature at 333 GHz (red lines) and at 246.2 GHz (green lines) for each source. The shaded grey area corresponds to the range of temperature for which the β values derived are authorised. The full range of optical depth values derived over the temperature range for each source is indicated on the top right side of the plot. For single systems, the bolometric temperature, Tbol, derived from Herschel (Furlan et al. 2016) is indicated by a blue dashed line and the radiative temperature, Trad, by a red dashed area or by a red dashed line in the case of FIR2. Black arrows indicate that the derived values are lower limits.
Current usage metrics show cumulative count of Article Views (full-text article views including HTML views, PDF and ePub downloads, according to the available data) and Abstracts Views on Vision4Press platform.
Data correspond to usage on the plateform after 2015. The current usage metrics is available 48-96 hours after online publication and is updated daily on week days.
Initial download of the metrics may take a while.