Fig. 1
Download original image
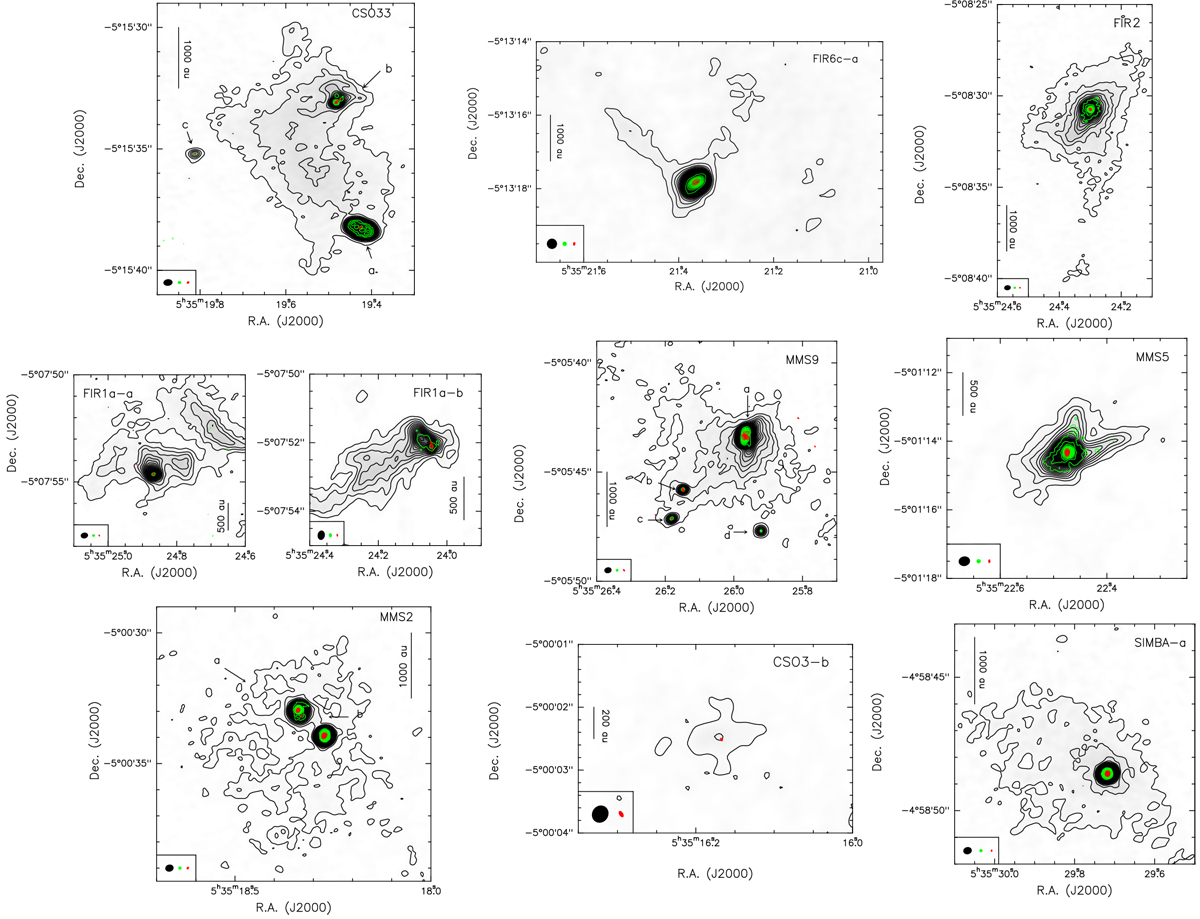
Continuum maps of the nine fields in Table 1, resolved into several cores, listed in Table 2. Each panel shows the superposition of the ORANGES 246.2 GHz dust continuum (ALMA, grey shaded area + black contours) with 333 GHz continuum (ALMA, green contours) and 32.9 GHz continuum (VLA, red contours), the latter retrieved from the ALMA archive. For the continuum at 246.2 GHz, levels start from 3σ with steps of5σ, except for FIR6c for which levels starts at 5σ and for CSO33, MMS9 and CSO3 for which level steps are of 7σ. Contours forthe 333 GHz data start at 5σ with steps of5σ, except for CSO33 and FIR1a-a for which contours start respectively at 3σ with steps of3σ and at 10σ with steps of5σ. Contours forthe 32.9 GHz data start at 5σ with steps of5σ, except for FIR1a-a, FIR1a-b, and CSO3-b for which contours start at 3σ with steps of5σ and for MMS9 for which contours start at 4σ with steps of5σ. Table 1 reports the 1σ values at each wavelengths. The synthesised beams at 246.2 GHz (black), 333 GHz (green), and 32.9 GHz (red) are depicted in the lower left corner of each panel.
Current usage metrics show cumulative count of Article Views (full-text article views including HTML views, PDF and ePub downloads, according to the available data) and Abstracts Views on Vision4Press platform.
Data correspond to usage on the plateform after 2015. The current usage metrics is available 48-96 hours after online publication and is updated daily on week days.
Initial download of the metrics may take a while.