Fig. 9
Download original image
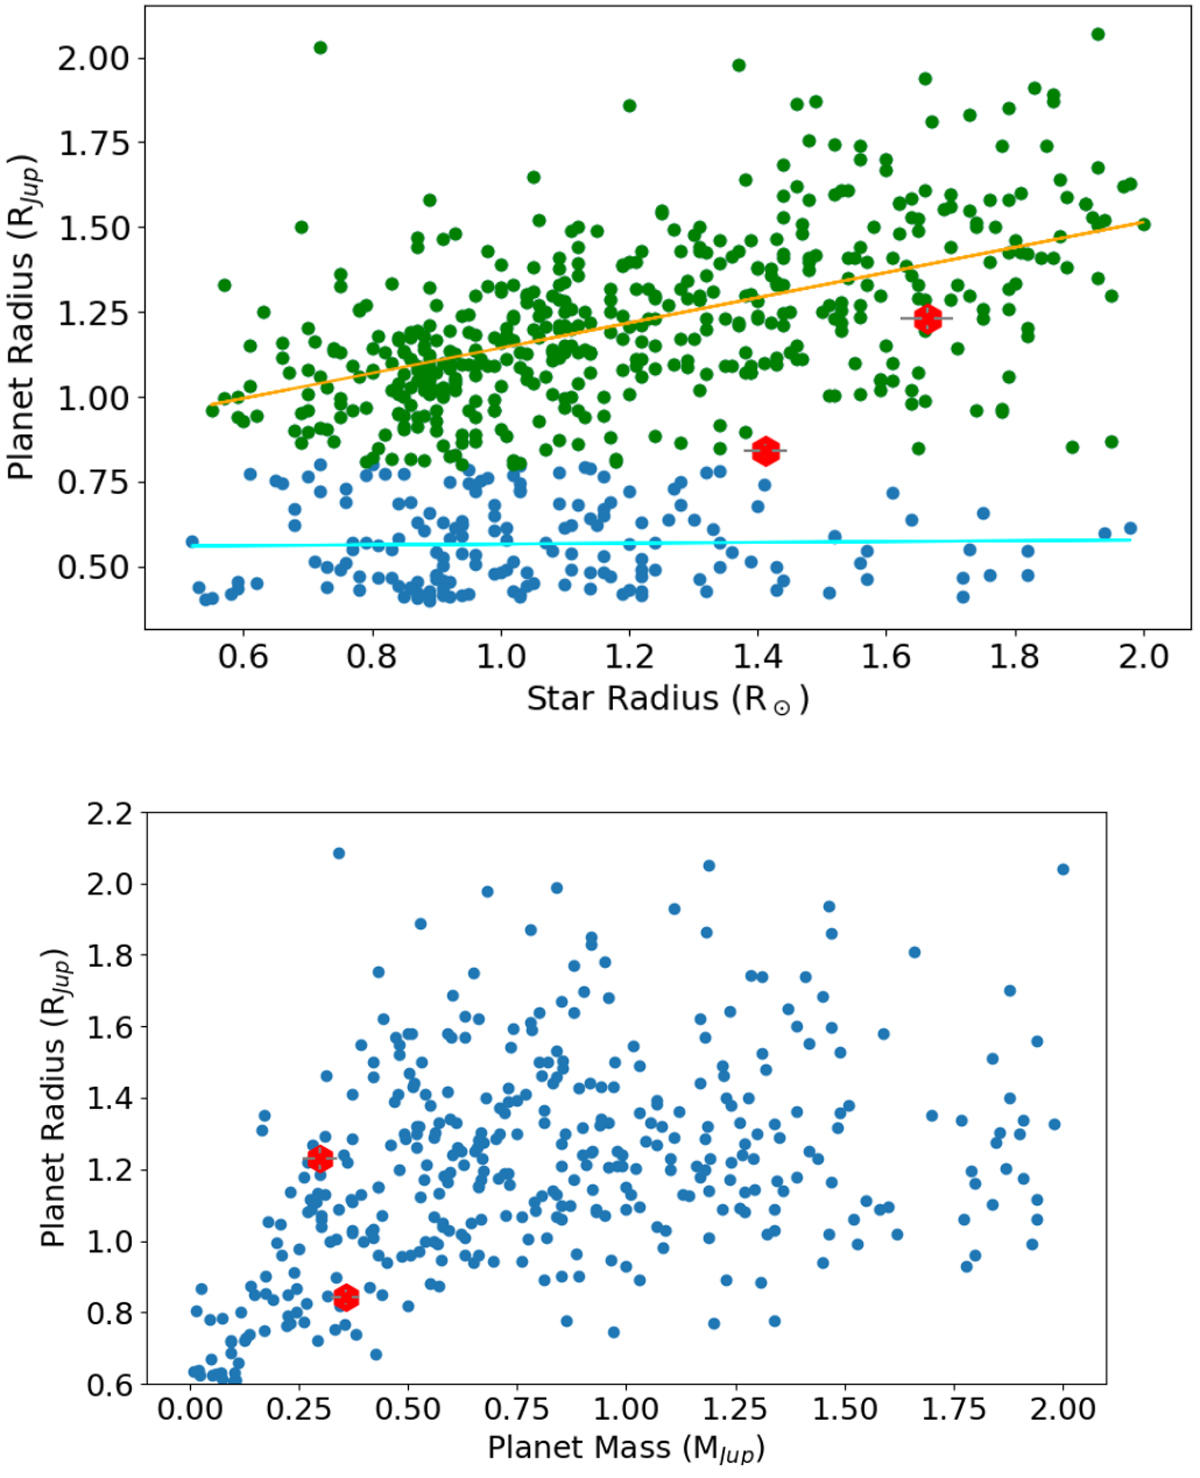
Top: planet radius as a function of stellar radius for all transiting giant planets. The two lines are linear fits for the populations of planets above (orange line, green dots) and below (cyan line, blue dots) the 0.8 RJup threshold (see text), respectively. Bottom: planet radius as a function of planet mass for transiting giant planets. Small dots represent all confirmed giant planets above 0.5 RJup from the NASA exoplanet archive3. The new planets in these parameter spaces are shown with the red symbols. Although of a similar mass, they differ significantly in radius.
Current usage metrics show cumulative count of Article Views (full-text article views including HTML views, PDF and ePub downloads, according to the available data) and Abstracts Views on Vision4Press platform.
Data correspond to usage on the plateform after 2015. The current usage metrics is available 48-96 hours after online publication and is updated daily on week days.
Initial download of the metrics may take a while.