Fig. 6
Download original image
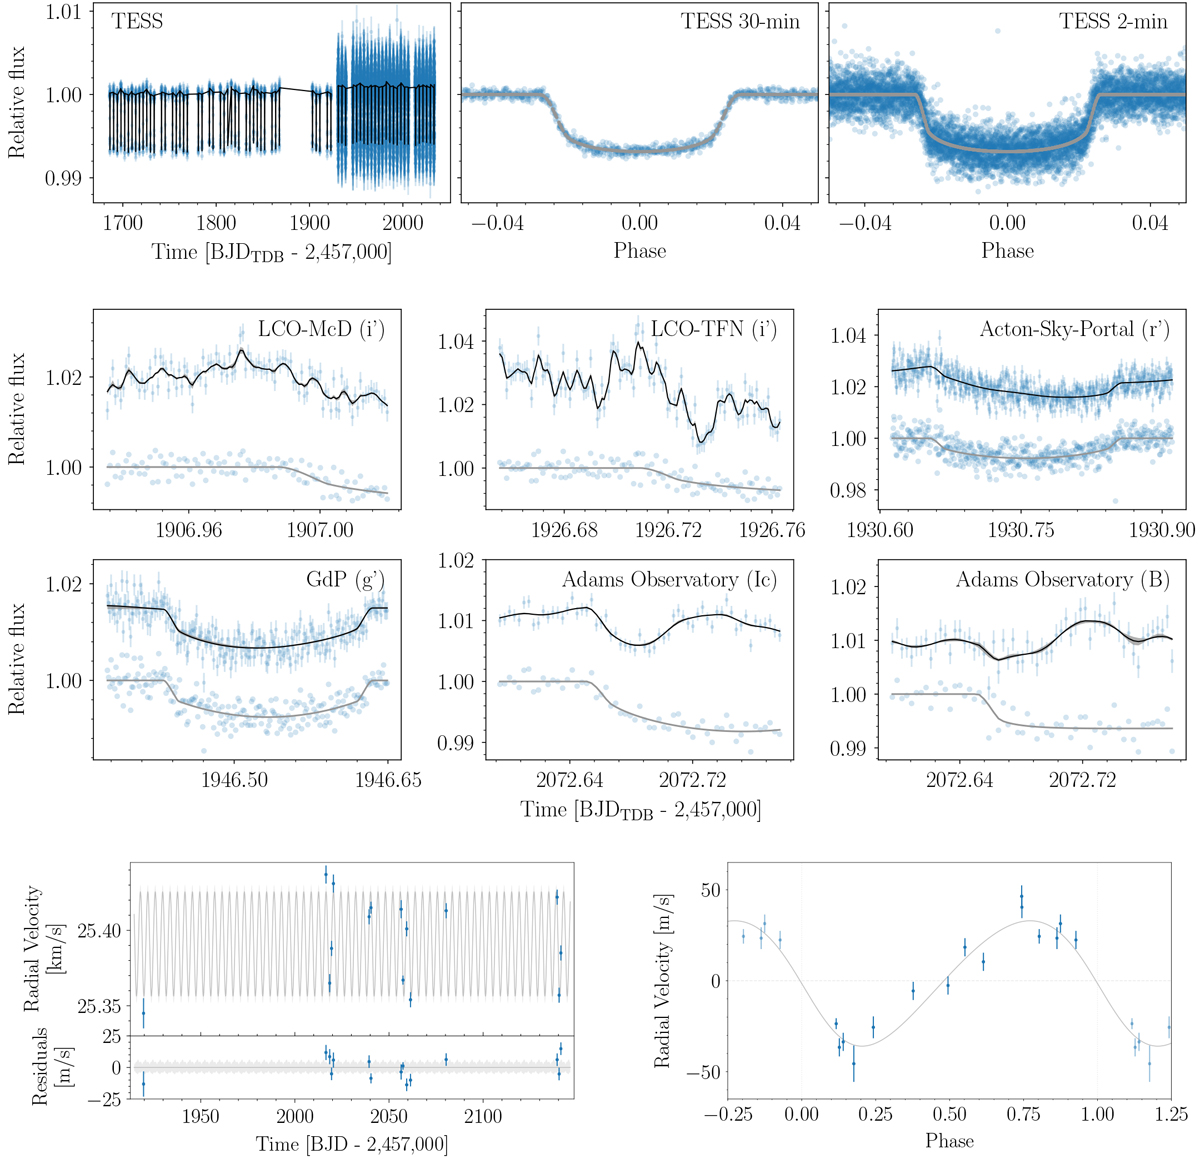
Modelling of data obtained on TOI-1296b. (Top) The TESS light curve in 30-min and 2-min cadence, and ExoFOP ground-based light curves; (bottom) The SOPHIE data series of RV versus time and folded RV data, together with the best-fit model (the time unit for the RV time series is BJDUTC). In all panels, blue data points with error bars show the observed data. Black lines and intervals in grey show the model median and the 68.3% credible interval computed from 1000 random posterior samples. Grey lines show the maximum a posteriori transit model. The blue points associated with those grey lines are the data points corrected for the best-fit Matern kernel. For the ground-based light curves, the observatory name and filters used for observations label the relevant plot.
Current usage metrics show cumulative count of Article Views (full-text article views including HTML views, PDF and ePub downloads, according to the available data) and Abstracts Views on Vision4Press platform.
Data correspond to usage on the plateform after 2015. The current usage metrics is available 48-96 hours after online publication and is updated daily on week days.
Initial download of the metrics may take a while.