Open Access
Fig. 5
Download original image
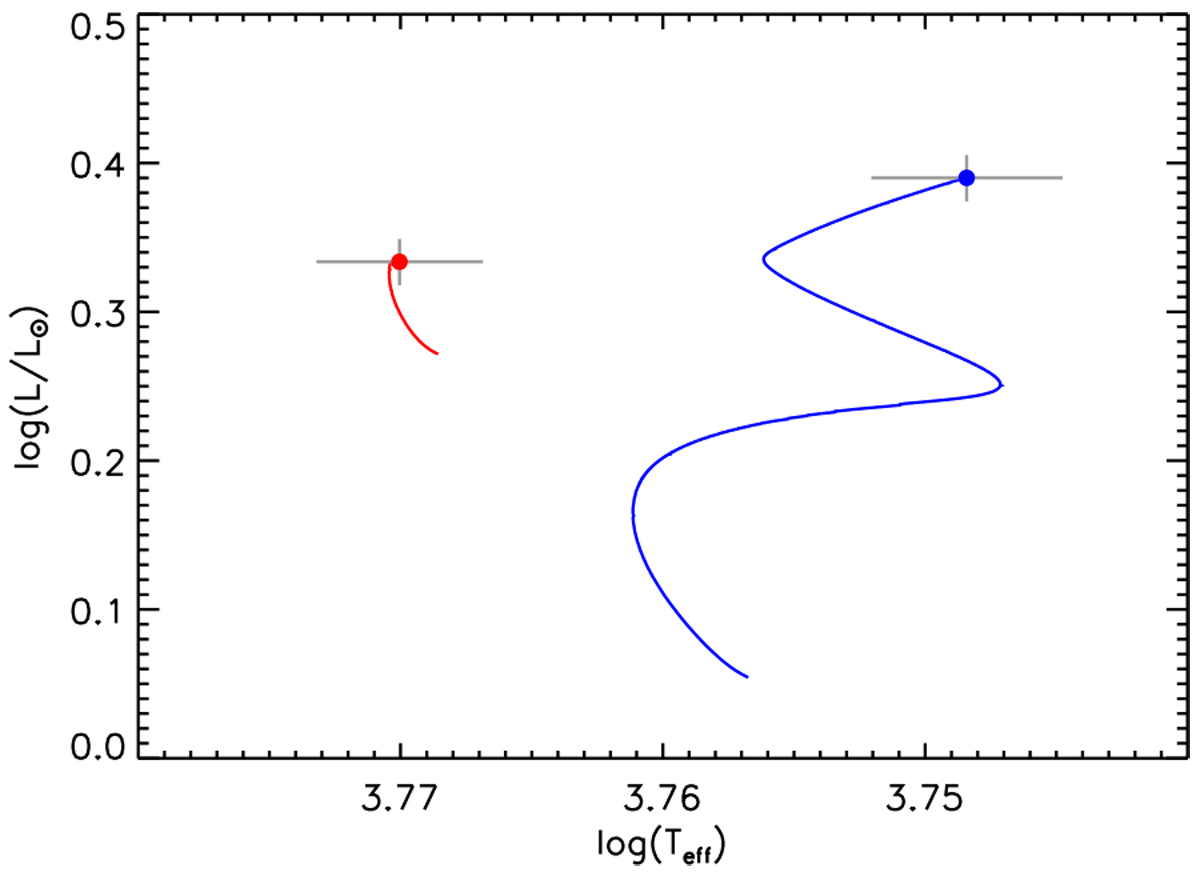
HR diagram in luminosity as a function of effective temperature. The isochrones are from the CESAM2k models (Morel 1997). Symbols show the measured position of TOI-1296 (blue) and TOI-1298 (red) in this diagram, the first one lying on the subgiant branch, and the second one on the main sequence.
Current usage metrics show cumulative count of Article Views (full-text article views including HTML views, PDF and ePub downloads, according to the available data) and Abstracts Views on Vision4Press platform.
Data correspond to usage on the plateform after 2015. The current usage metrics is available 48-96 hours after online publication and is updated daily on week days.
Initial download of the metrics may take a while.