Fig. C.1
Download original image
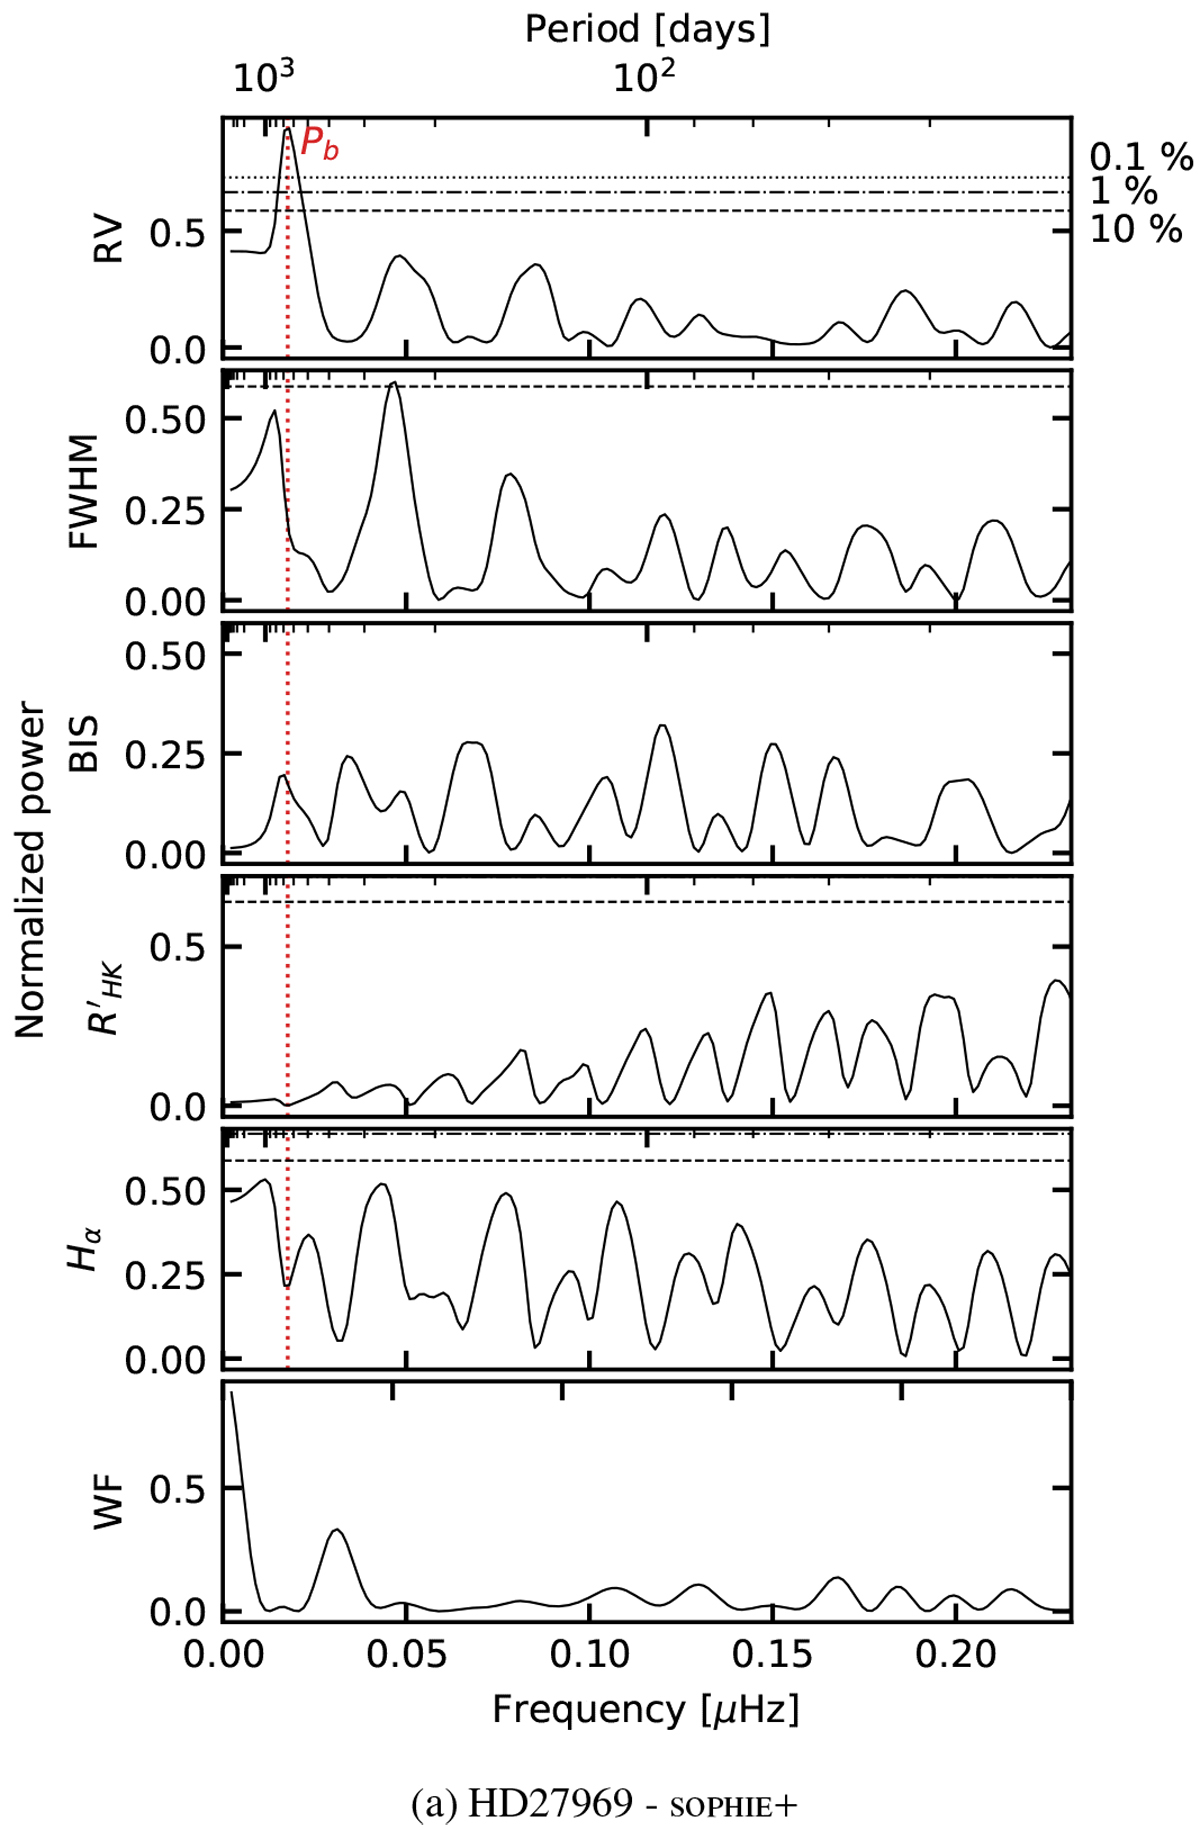
GLSP of the RV and the available activity indicators measured on HD 27969 with the SOPHIE (SOPHIE+) spectrograph. From top to bottom: GLSP of the RV, FWHM, BIS, and ![]() time series and the window function of the data. The best-fit orbital period of the planet is marked by a vertical dashed red line. The black horizontal dotted, dash-dotted and dashed lines correspond to levels of 0.1, 1 and 10% of FAP (Zechmeister & Kürster 2009).
time series and the window function of the data. The best-fit orbital period of the planet is marked by a vertical dashed red line. The black horizontal dotted, dash-dotted and dashed lines correspond to levels of 0.1, 1 and 10% of FAP (Zechmeister & Kürster 2009).
Current usage metrics show cumulative count of Article Views (full-text article views including HTML views, PDF and ePub downloads, according to the available data) and Abstracts Views on Vision4Press platform.
Data correspond to usage on the plateform after 2015. The current usage metrics is available 48-96 hours after online publication and is updated daily on week days.
Initial download of the metrics may take a while.