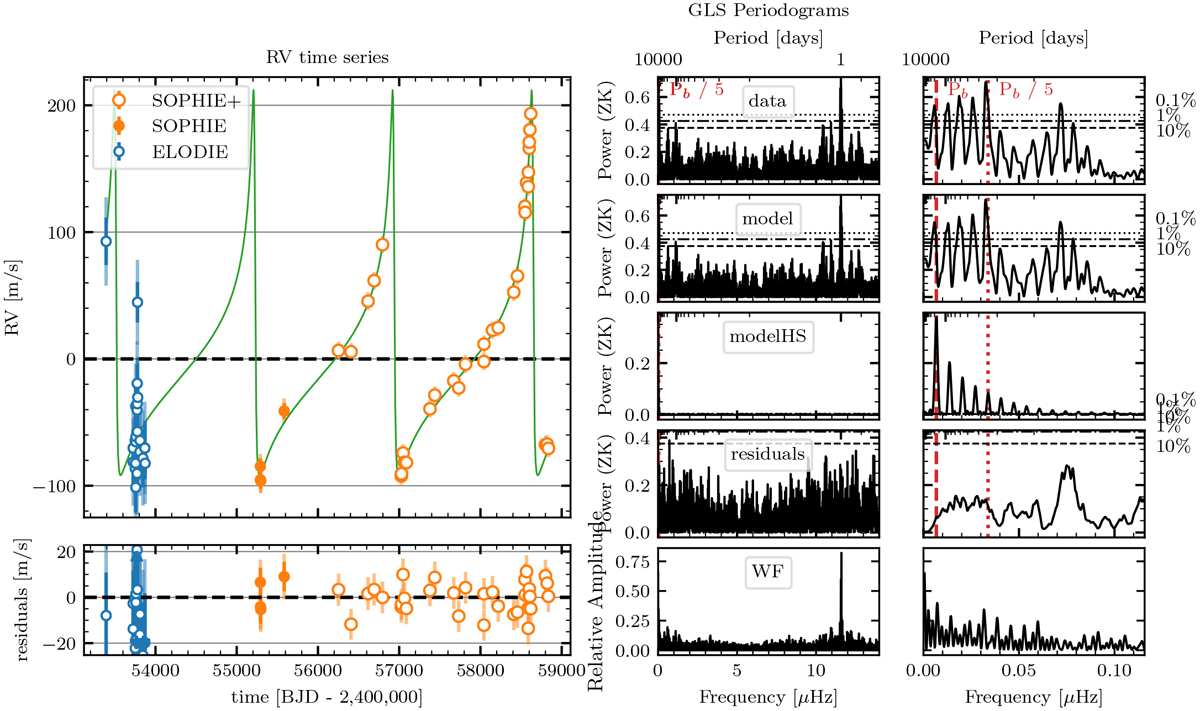
Fig. B.2
Download original image
Radial velocities, best-fit model, and residuals for the HD 80869 system. This figure is structured and generated in the same way as Fig. B.1 (see the caption of that figure for more details). The main difference is that in this case we add, in the third row, the GLSP of the planetary model sampled at 10 000 times, evenly spread over the time span of our observations (modelHS). This allows us to visualize the harmonic content of this highly eccentric orbit and better understand the GLSP of our RV data.
Current usage metrics show cumulative count of Article Views (full-text article views including HTML views, PDF and ePub downloads, according to the available data) and Abstracts Views on Vision4Press platform.
Data correspond to usage on the plateform after 2015. The current usage metrics is available 48-96 hours after online publication and is updated daily on week days.
Initial download of the metrics may take a while.