Fig. B.1
Download original image
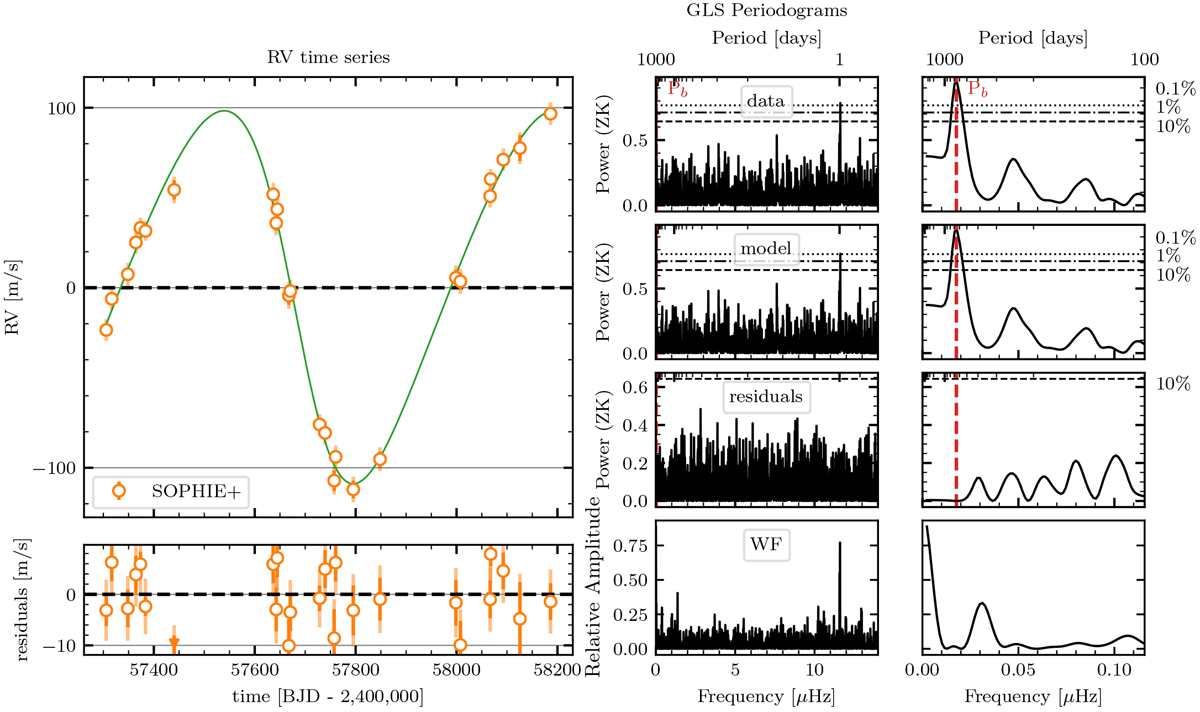
Radial velocities, best-fit model, and residuals for the HD27969 system. Left-top: RV time series and best-fit model, from which the systemic velocity and the offsets between instruments have been removed. Left-bottom: time series of the residuals of the best-fit model. The color and filling of the points indicate the instrument used to acquire the data: empty blue for ELODIE, filled orange for SOPHIE, and empty orange for SOPHIE+. The error bars provided with the RV data are displayed with the same opacity and color as the points. The extended error bars computed with the fitted additive jitter parameters are displayed with a higher transparency. Middle, top: GLSP of the RV time series, the best-fit model sampled at the same times as the RV s (middle, second from the top), the residuals (middle, third from top), and the window function (middle, bottom). Right: GLSP s zoomed-in around the period of the detected planet. The best-fit orbital period of the planet is marked by a vertical dashed red line. The horizontal dotted, dash-dotted, and dashed black lines correspond to 0.1, 1, and 10% FAP (Zechmeister & Kürster 2009) levels, respectively.
Current usage metrics show cumulative count of Article Views (full-text article views including HTML views, PDF and ePub downloads, according to the available data) and Abstracts Views on Vision4Press platform.
Data correspond to usage on the plateform after 2015. The current usage metrics is available 48-96 hours after online publication and is updated daily on week days.
Initial download of the metrics may take a while.