Fig. C.5
Download original image
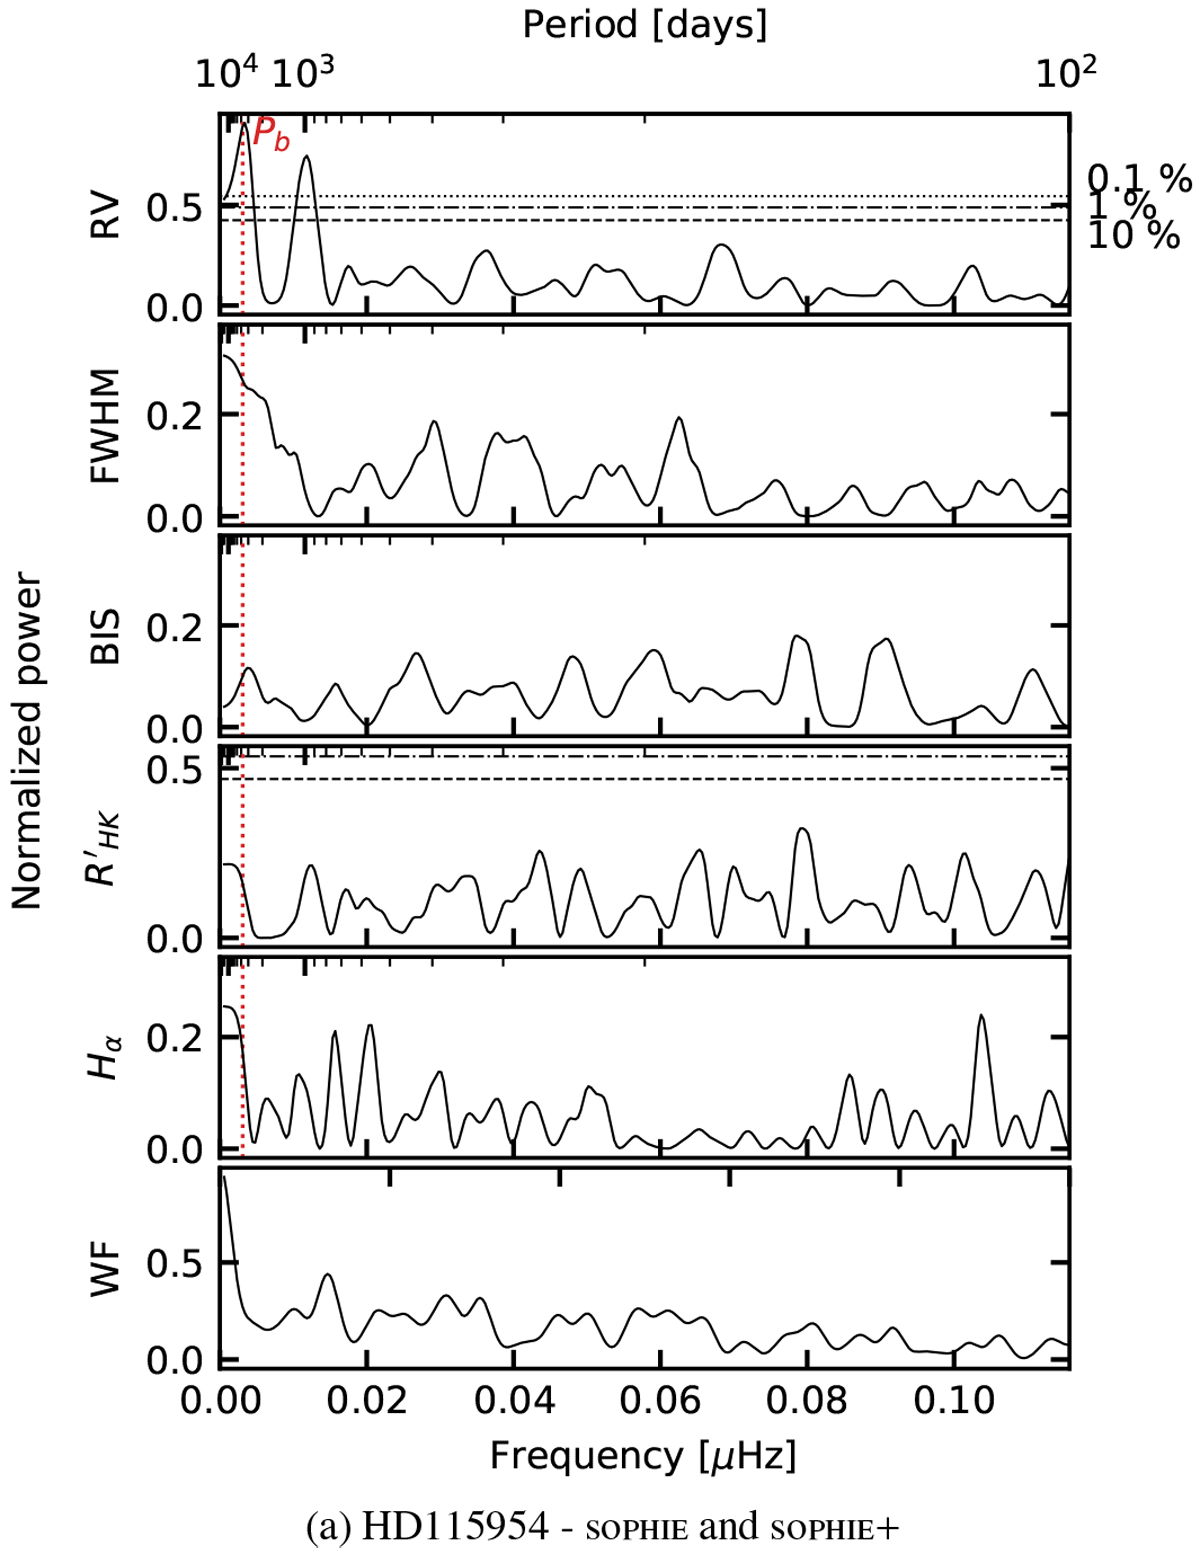
GLSP of the RV and the available activity indicators measured on HD 115954 with the SOPHIE (SOPHIE and SOPHIE+) spectrograph. From top to bottom: GLSP of the RV, FWHM, BIS, and
![]() time series and the window function of the data. For the GLSP of the RV data, the offset between SOPHIE and SOPHIE+ is corrected prior to the computation of the GLSP using the value provided in Table E.1. Due to the limited number (four) of data points taken with ELODIE, we do not present the GLSP as they do not contain much information.The rest of the format of this figure is the same as Fig. C.1 (see the caption of that figure for more details).
time series and the window function of the data. For the GLSP of the RV data, the offset between SOPHIE and SOPHIE+ is corrected prior to the computation of the GLSP using the value provided in Table E.1. Due to the limited number (four) of data points taken with ELODIE, we do not present the GLSP as they do not contain much information.The rest of the format of this figure is the same as Fig. C.1 (see the caption of that figure for more details).
Current usage metrics show cumulative count of Article Views (full-text article views including HTML views, PDF and ePub downloads, according to the available data) and Abstracts Views on Vision4Press platform.
Data correspond to usage on the plateform after 2015. The current usage metrics is available 48-96 hours after online publication and is updated daily on week days.
Initial download of the metrics may take a while.