Fig. 1
Download original image
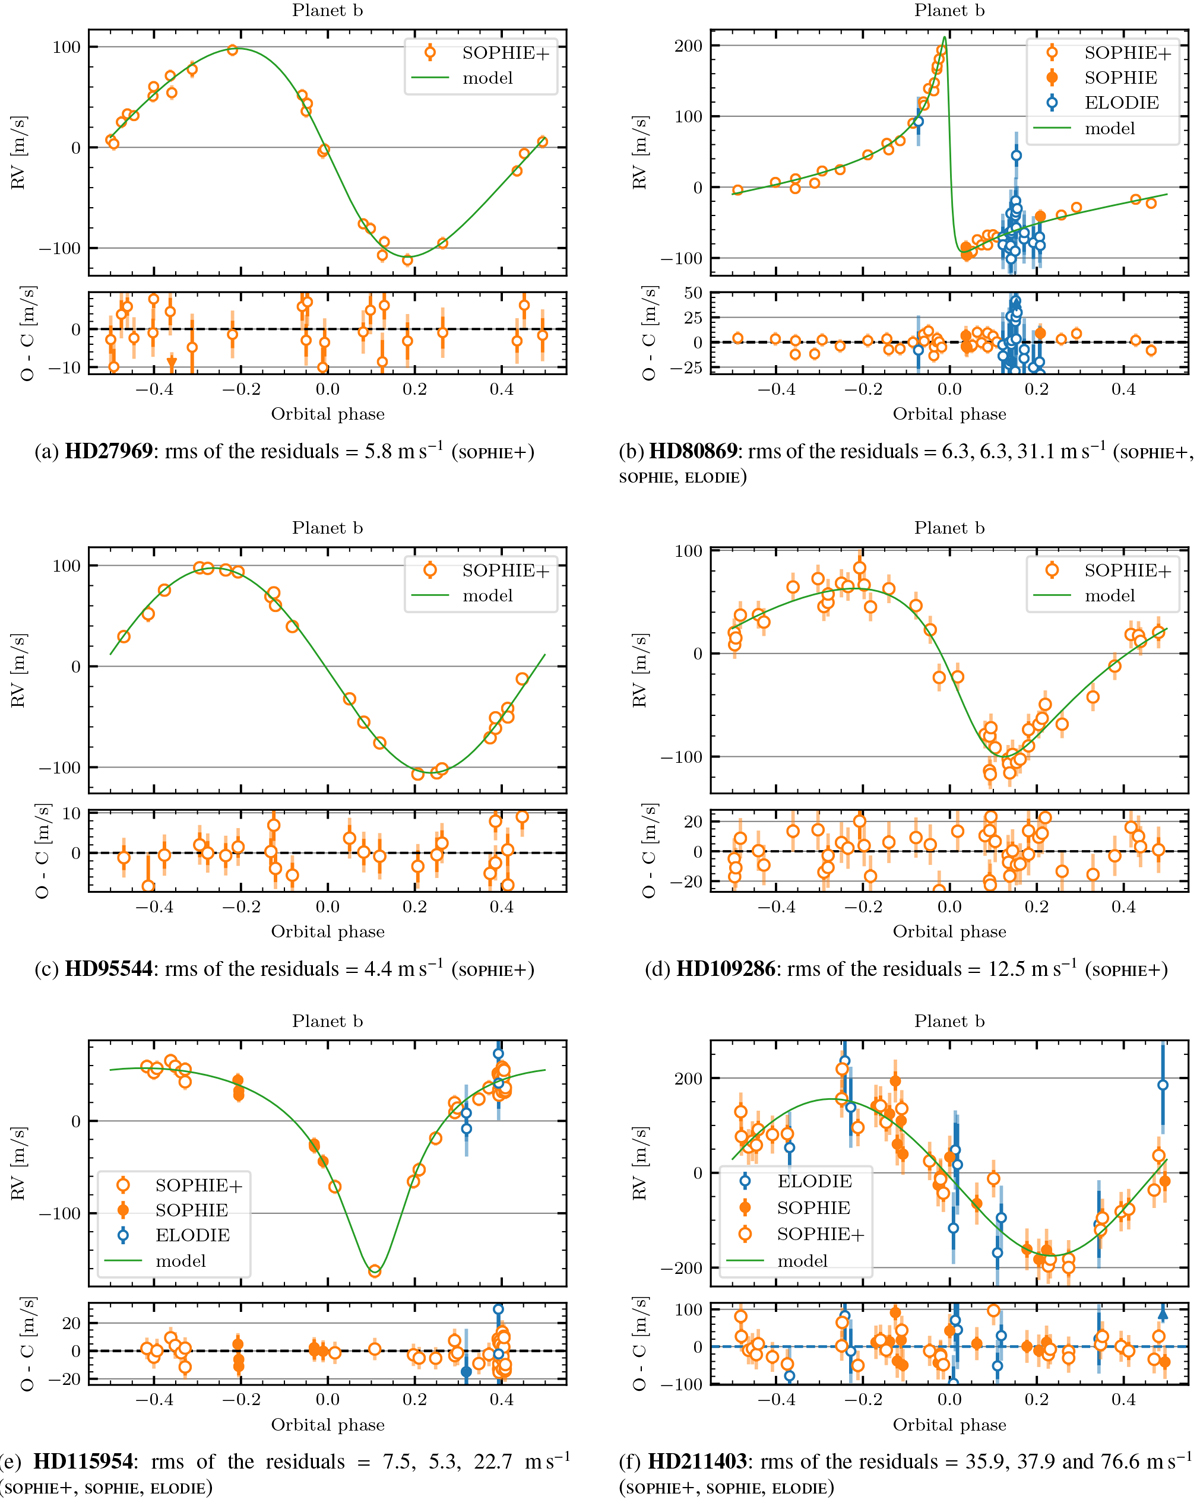
Phase-folded RV curves for our six planets with the best-fit models. The color and filling of the points indicate the instrument used to acquire the data: empty blue for ELODIE, filled orange for SOPHIE, and empty orange for SOPHIE+. The error bars provided with the RV data are displayed with the same opacity and color as the points. The extended error bars computed with the fitted jitter parameters are displayed with a higher transparency. The best-fit model is represented with a greenline. The RV time series (not phase folded) are also displayed in Fig. B.1–B.4.
Current usage metrics show cumulative count of Article Views (full-text article views including HTML views, PDF and ePub downloads, according to the available data) and Abstracts Views on Vision4Press platform.
Data correspond to usage on the plateform after 2015. The current usage metrics is available 48-96 hours after online publication and is updated daily on week days.
Initial download of the metrics may take a while.