Fig. 6.
Download original image
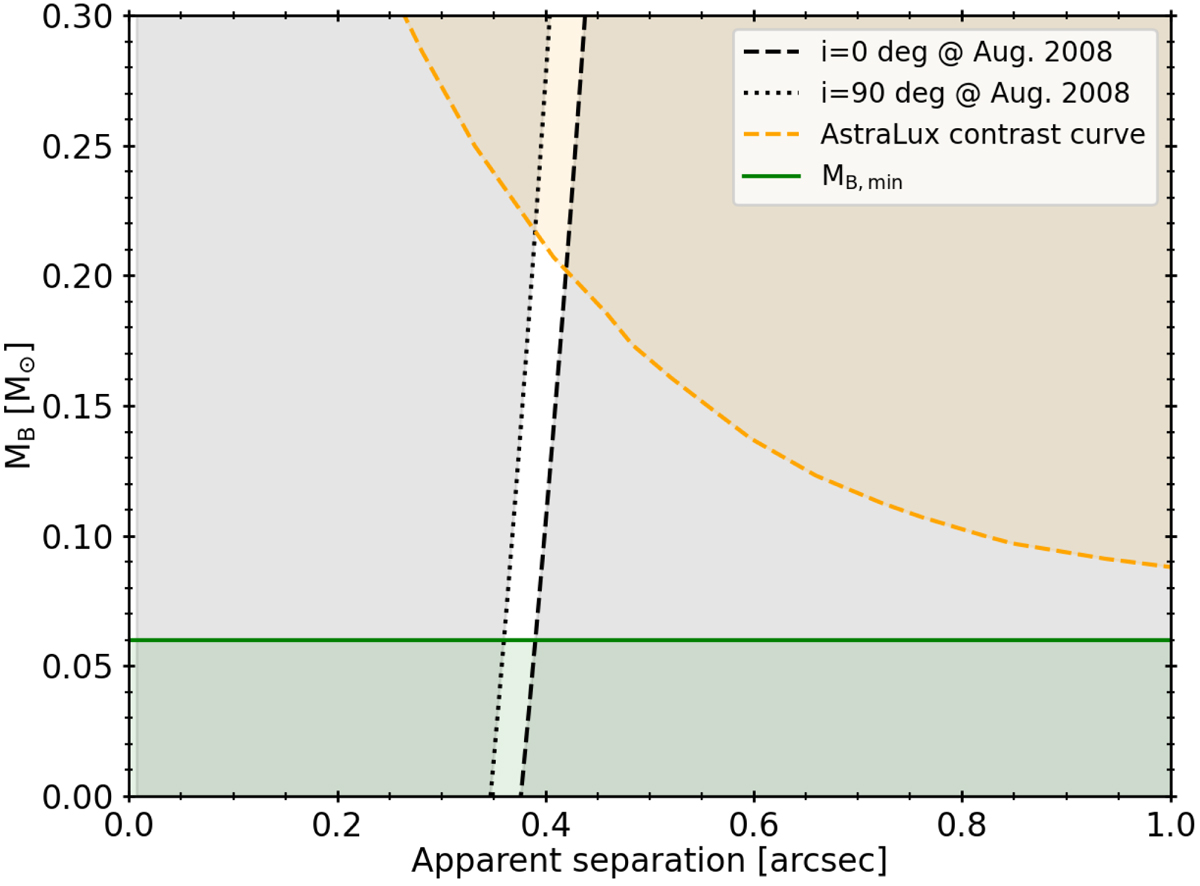
Constraint on the mass of the secondary star in GJ 912 as a function of the apparent angular separation of the two components. The orange dashed line represents the contrast curve of the AstraLux observation by Jódar et al. (2013). The green solid line indicates the minimum mass limit computed from our RVs. The dashed and dotted black lines are constraints from RVs on the angular separation at the time of the observation, assuming inclinations between 0 deg (dashed) and 90 deg (dotted). The shaded regions indicate mass values that are not compatible with the observations.
Current usage metrics show cumulative count of Article Views (full-text article views including HTML views, PDF and ePub downloads, according to the available data) and Abstracts Views on Vision4Press platform.
Data correspond to usage on the plateform after 2015. The current usage metrics is available 48-96 hours after online publication and is updated daily on week days.
Initial download of the metrics may take a while.