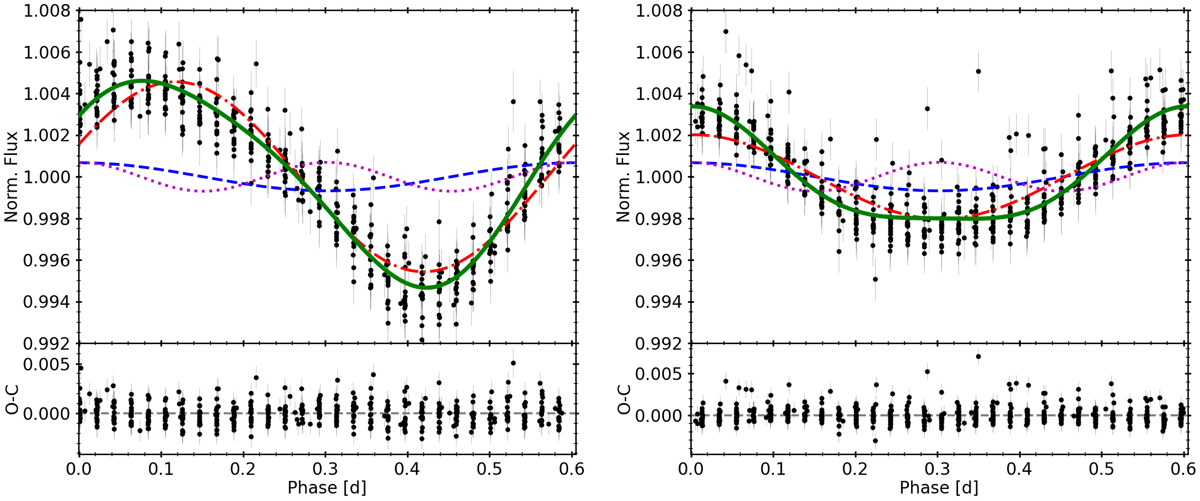
Fig. 3.
Download original image
Hourly binned photometry of GJ 207.1 from TESS sectors 6 (left) and 32 (right), phase folded to the orbital period. We show the best fit, described by Eq. (4), as a green solid line. The activity-induced variability is shown as a dash-dotted red line, while the magenta dotted line and the dashed blue line describe the ellipsoidal effect and the Doppler beaming, respectively. Bottom panels: residuals of the best fit.
Current usage metrics show cumulative count of Article Views (full-text article views including HTML views, PDF and ePub downloads, according to the available data) and Abstracts Views on Vision4Press platform.
Data correspond to usage on the plateform after 2015. The current usage metrics is available 48-96 hours after online publication and is updated daily on week days.
Initial download of the metrics may take a while.