Free Access
Fig. 15.
Download original image
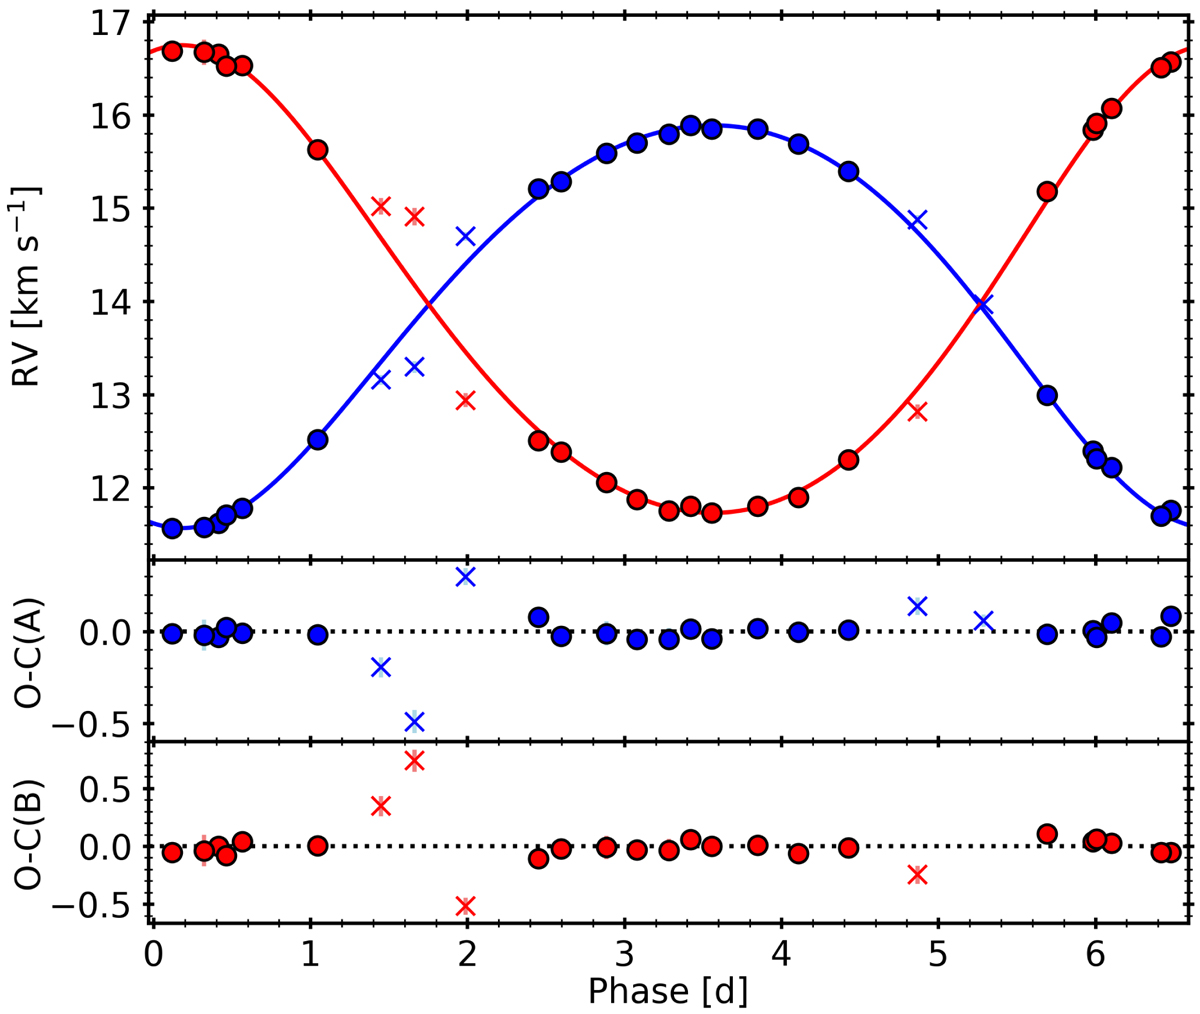
todmor RV curves of UCAC4 355−020729 as a function of the orbital phase, along with their best-fitting models. The blue and red circles correspond to the primary and secondary components, respectively, while the crosses indicate data points not used in the fit. The residuals from the fit are shown in the bottom panels.
Current usage metrics show cumulative count of Article Views (full-text article views including HTML views, PDF and ePub downloads, according to the available data) and Abstracts Views on Vision4Press platform.
Data correspond to usage on the plateform after 2015. The current usage metrics is available 48-96 hours after online publication and is updated daily on week days.
Initial download of the metrics may take a while.