Fig. 12.
Download original image
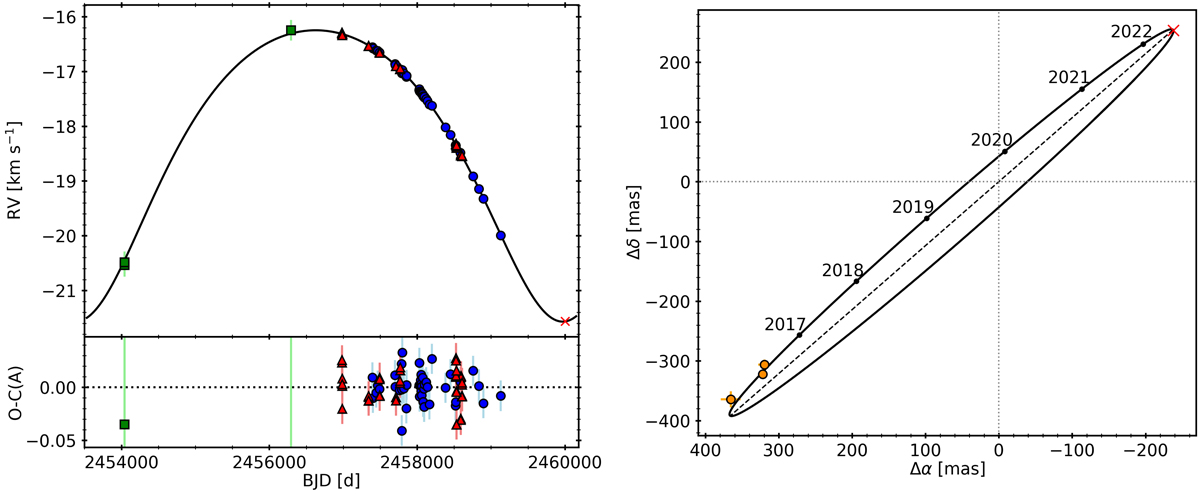
Best joint orbital fit to the spectroscopic data and differential astrometry of GJ 282 C. Left: RVs of GJ 282 C from CARMENES (blue cicles), HARPS (red triangles), and FEROS (green squares) as a function of time. The residuals from the fit are shown in the bottom panel, except for FEROS, which are outside the Y-axis scale. Right: differential astrometry between GJ 282 Ca and GJ 282 Cb. Orange circles show the astrometric relative position measured from NACO observations. The red cross gives the position of periastron, while the dashed line indicates the line of nodes.
Current usage metrics show cumulative count of Article Views (full-text article views including HTML views, PDF and ePub downloads, according to the available data) and Abstracts Views on Vision4Press platform.
Data correspond to usage on the plateform after 2015. The current usage metrics is available 48-96 hours after online publication and is updated daily on week days.
Initial download of the metrics may take a while.