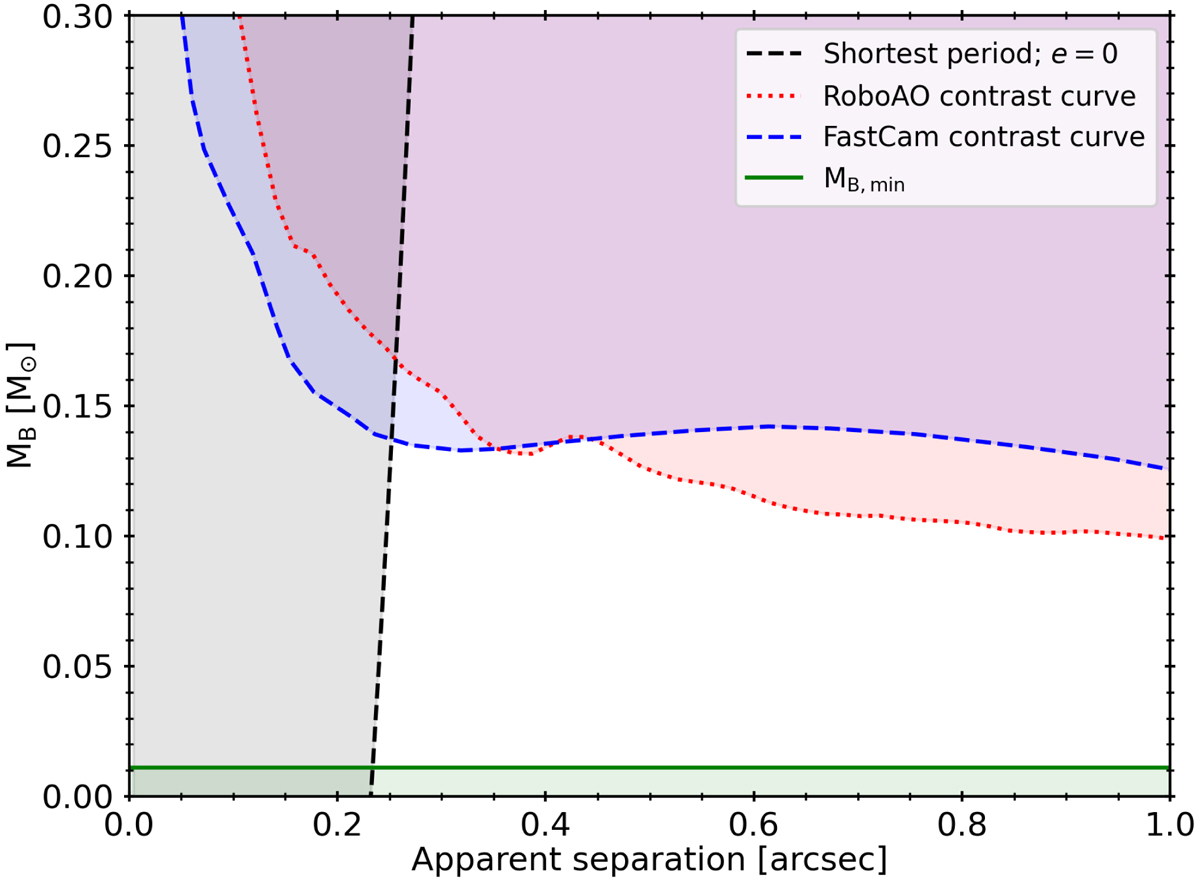
Fig. 10.
Download original image
Constraints on the mass of the secondary star in LP 427−016 as a function of the apparent separation of the two components. The red dotted and blue dashed lines depict the contrast curves of the RoboAO and FastCam observations, respectively. The green line indicates the minimum mass limit computed from RVs, of 0.011 M⊙. The black dashed line is the apparent separation for the lower limits to the period, assuming a circular orbit and i = 90 deg. The shaded regions indicate solutions that are not consistent with the observations.
Current usage metrics show cumulative count of Article Views (full-text article views including HTML views, PDF and ePub downloads, according to the available data) and Abstracts Views on Vision4Press platform.
Data correspond to usage on the plateform after 2015. The current usage metrics is available 48-96 hours after online publication and is updated daily on week days.
Initial download of the metrics may take a while.