Fig. 5.
Download original image
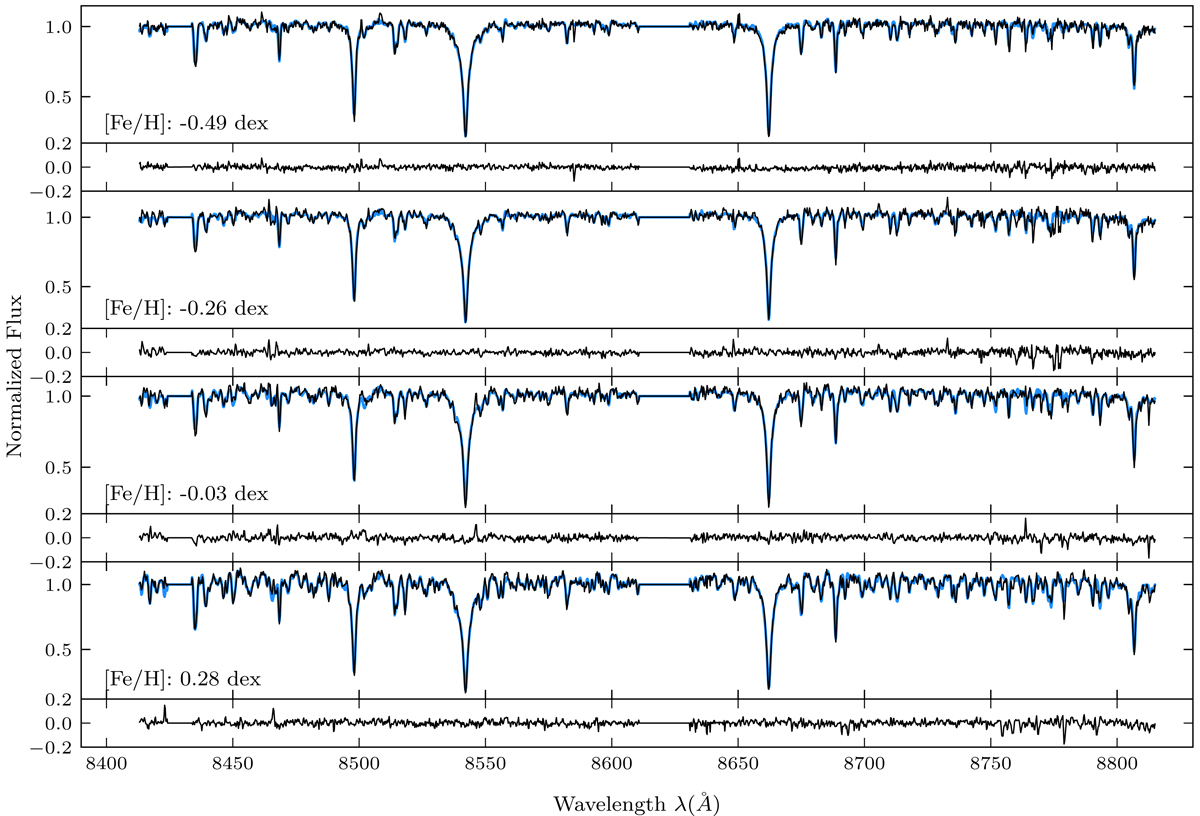
Normalised ARGOS spectra (black) versus the normalised model spectra (blue) generated by The Cannon for A2A stars with [Fe/H] values between −0.5 ≲ [Fe/H] ≲ 0.25. The plotted line thicknesses of the model spectra indicate the scatter of each fit by The Cannon. The residuals between the normalised ARGOS spectra and normalised model spectra are also shown in the panels below the spectra.
Current usage metrics show cumulative count of Article Views (full-text article views including HTML views, PDF and ePub downloads, according to the available data) and Abstracts Views on Vision4Press platform.
Data correspond to usage on the plateform after 2015. The current usage metrics is available 48-96 hours after online publication and is updated daily on week days.
Initial download of the metrics may take a while.