Open Access
Fig. 26.
Download original image
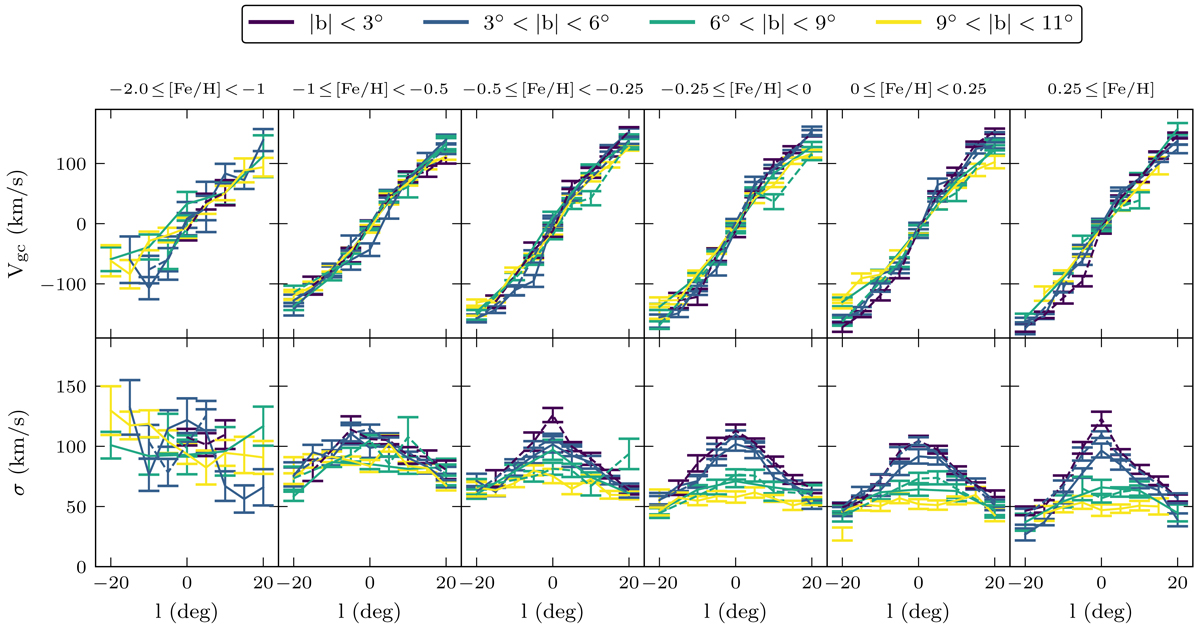
Mean radial velocity (top) and velocity dispersion (bottom) versus longitude and latitude in different [Fe/H] bins. The line colour indicates the latitude range. Dashed lines connect APOGEE fields, and solid lines connect A2A fields. All stars are required to have Rgc < 4.5 kpc.
Current usage metrics show cumulative count of Article Views (full-text article views including HTML views, PDF and ePub downloads, according to the available data) and Abstracts Views on Vision4Press platform.
Data correspond to usage on the plateform after 2015. The current usage metrics is available 48-96 hours after online publication and is updated daily on week days.
Initial download of the metrics may take a while.