Fig. 25.
Download original image
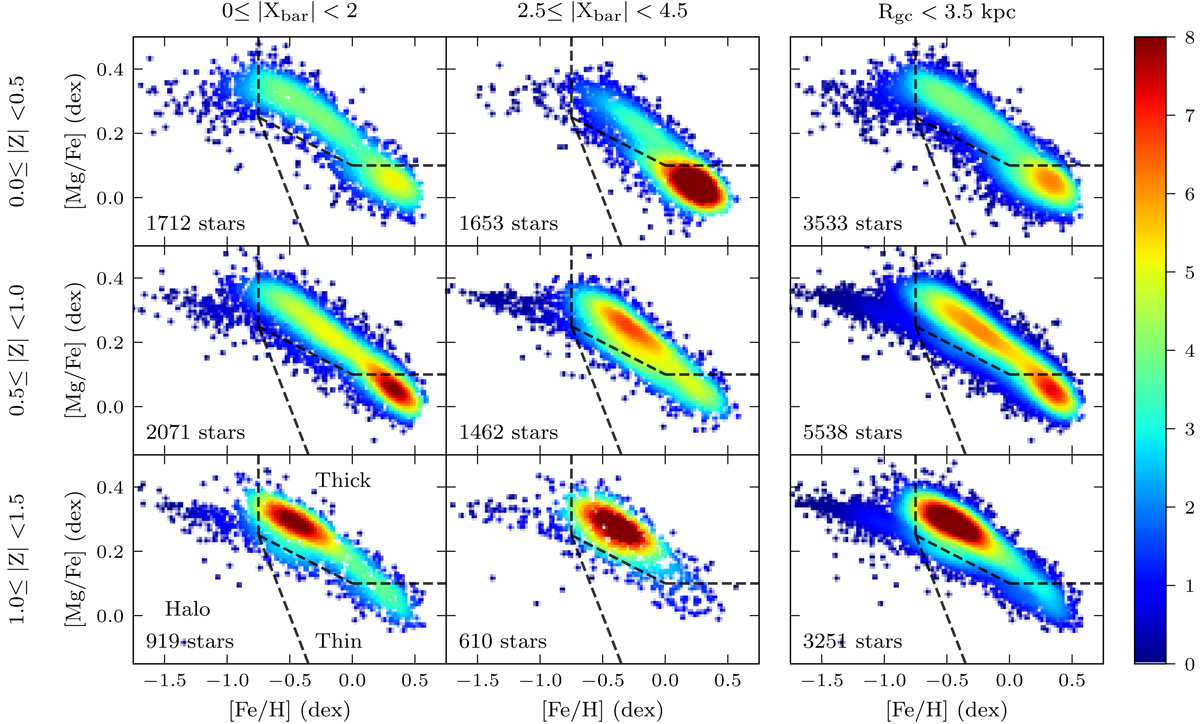
[Mg/Fe] − [Fe/H] distribution for A2A and APOGEE stars in intervals of vertical height (in kpc), for the inner bulge (left column), long bar-outer bulge region (middle column), and within a galactocentric radius of 3.5 kpc (right column). The stars in the first two columns are required to have |Ybar| < 1 kpc. For plot specifics, see the caption of Fig. 24.
Current usage metrics show cumulative count of Article Views (full-text article views including HTML views, PDF and ePub downloads, according to the available data) and Abstracts Views on Vision4Press platform.
Data correspond to usage on the plateform after 2015. The current usage metrics is available 48-96 hours after online publication and is updated daily on week days.
Initial download of the metrics may take a while.