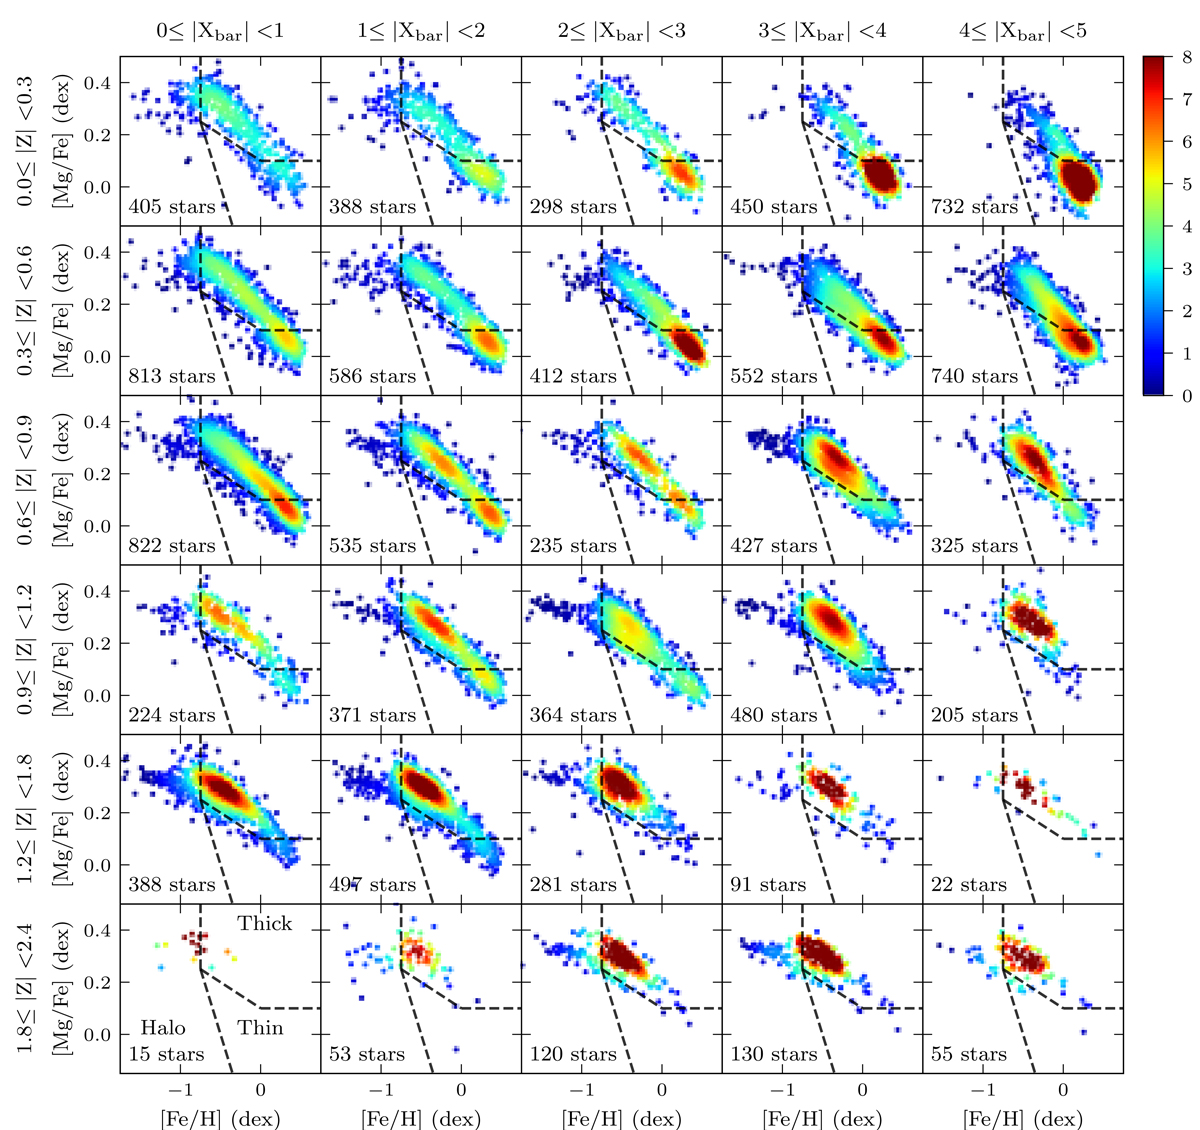
Fig. 24.
Download original image
[Mg/Fe] − [Fe/H] distribution of A2A and APOGEE stars in intervals of height from the plane (|Z|, kpc) and distance along the bar (|Xbar|, kpc). The stars are required to have |Ybar| < 1 kpc. The point colour gives the Gaussian kernel density estimate. The dashed lines separate the different regions in the parameter space generally populated by the halo, thin disk, and thick disk (defined in the lower-leftmost plot; see text). The number of stars composing each plot (A2A RC stars + APOGEE stars) is given in the lower left corner of each plot.
Current usage metrics show cumulative count of Article Views (full-text article views including HTML views, PDF and ePub downloads, according to the available data) and Abstracts Views on Vision4Press platform.
Data correspond to usage on the plateform after 2015. The current usage metrics is available 48-96 hours after online publication and is updated daily on week days.
Initial download of the metrics may take a while.