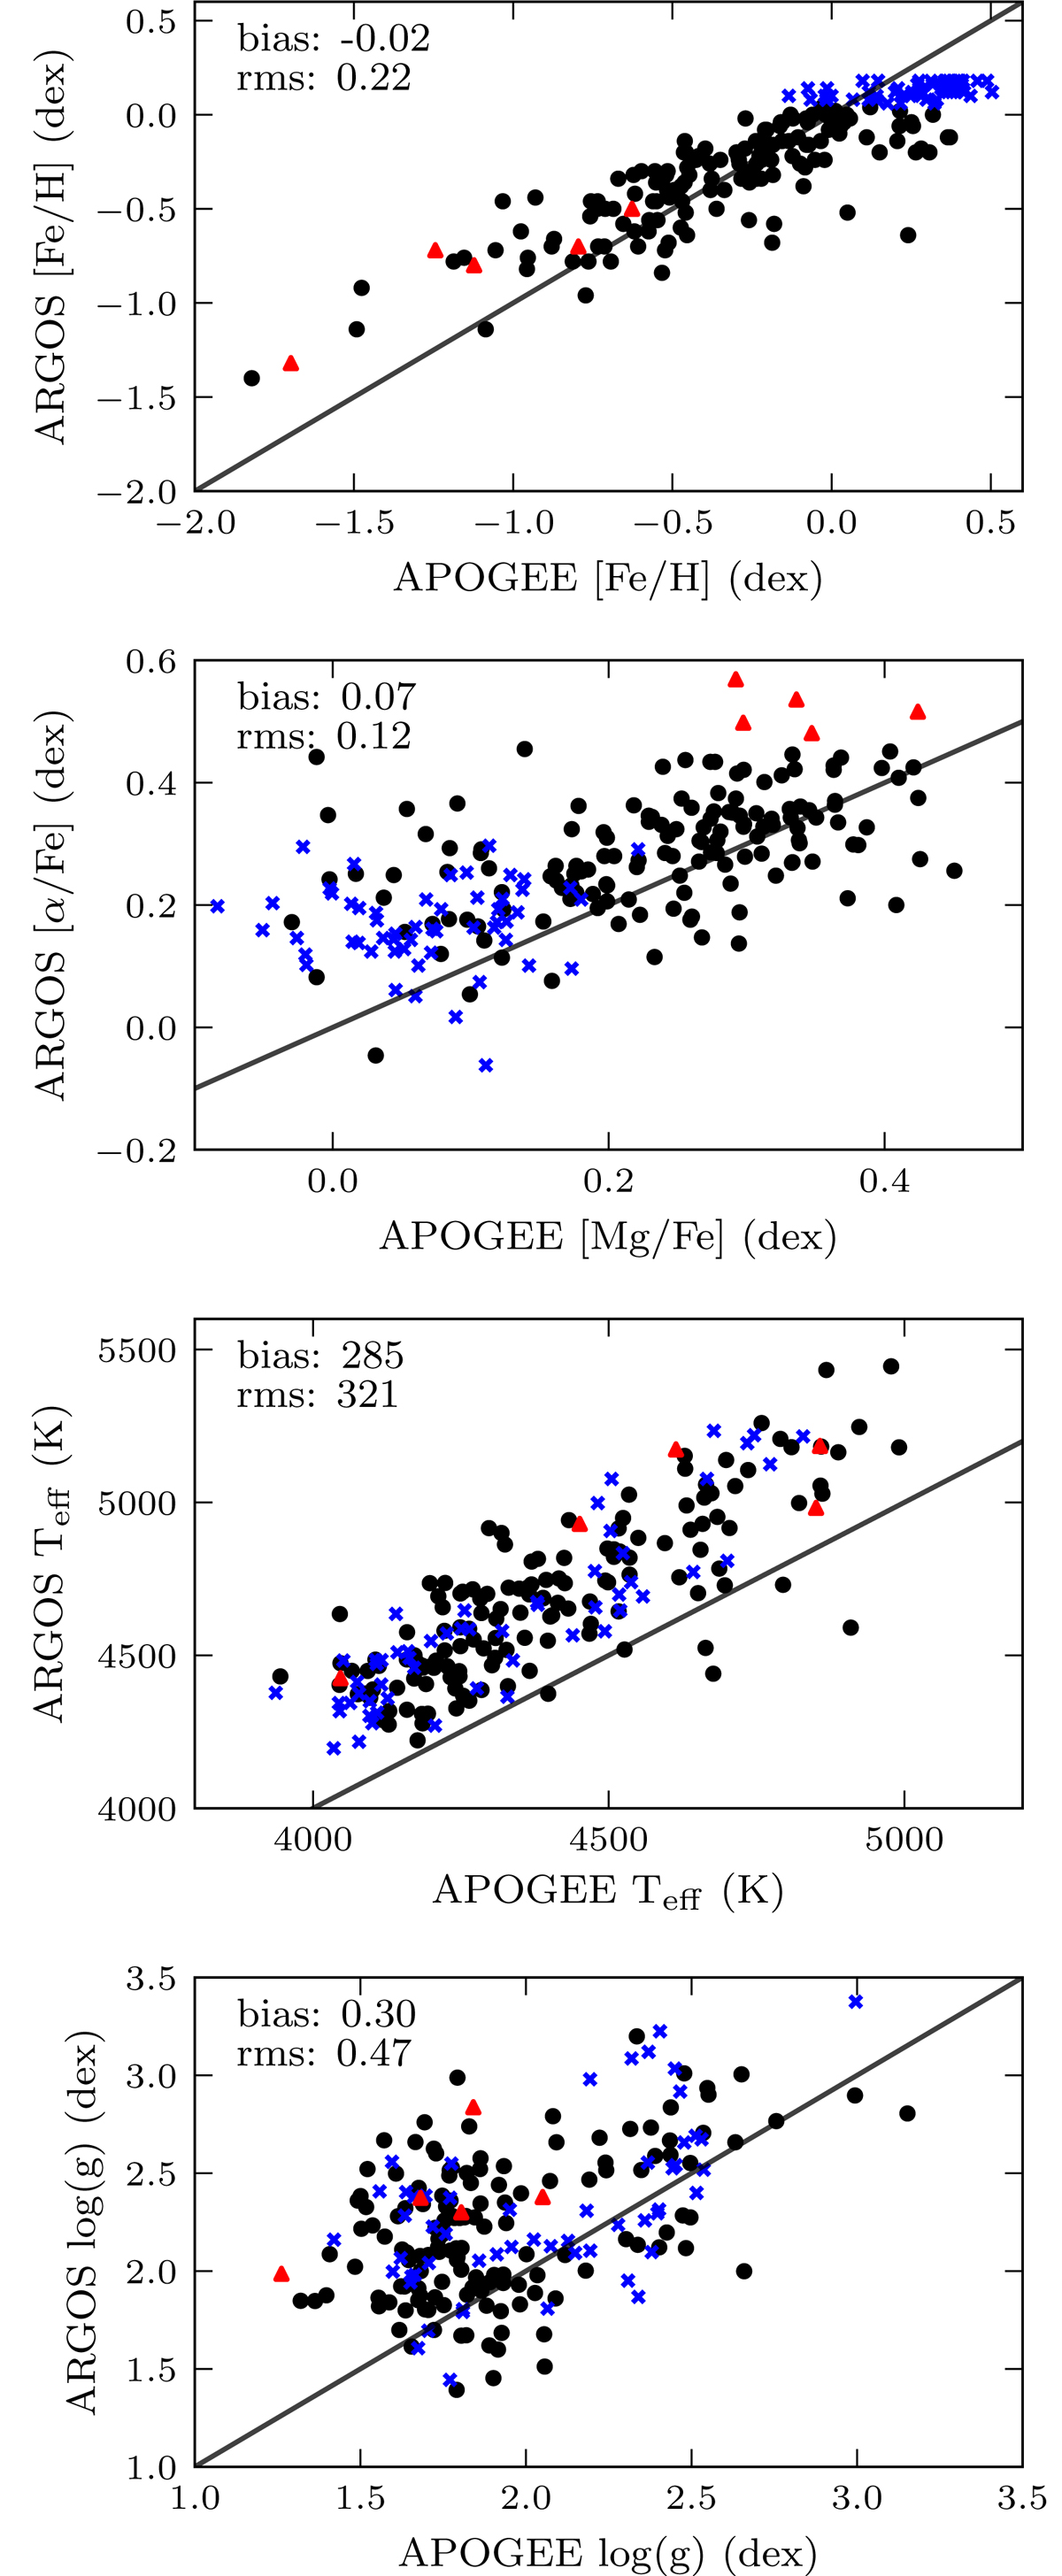
Fig. 2.
Download original image
APOGEE-derived parameters (x axis) versus ARGOS derived parameters (y axis) for the 204 reference set stars observed by both surveys. The bias (mean of the differences) and rms of the distributions are given in the upper left hand corner of each plot. The reference set stars that are within one ARGOS observational error, 0.13 dex (0.1 dex), from the maximum [Fe/H] ([α/Fe]) value reached by the reference set are plotted as blue crosses (red triangles).
Current usage metrics show cumulative count of Article Views (full-text article views including HTML views, PDF and ePub downloads, according to the available data) and Abstracts Views on Vision4Press platform.
Data correspond to usage on the plateform after 2015. The current usage metrics is available 48-96 hours after online publication and is updated daily on week days.
Initial download of the metrics may take a while.