Fig. 18.
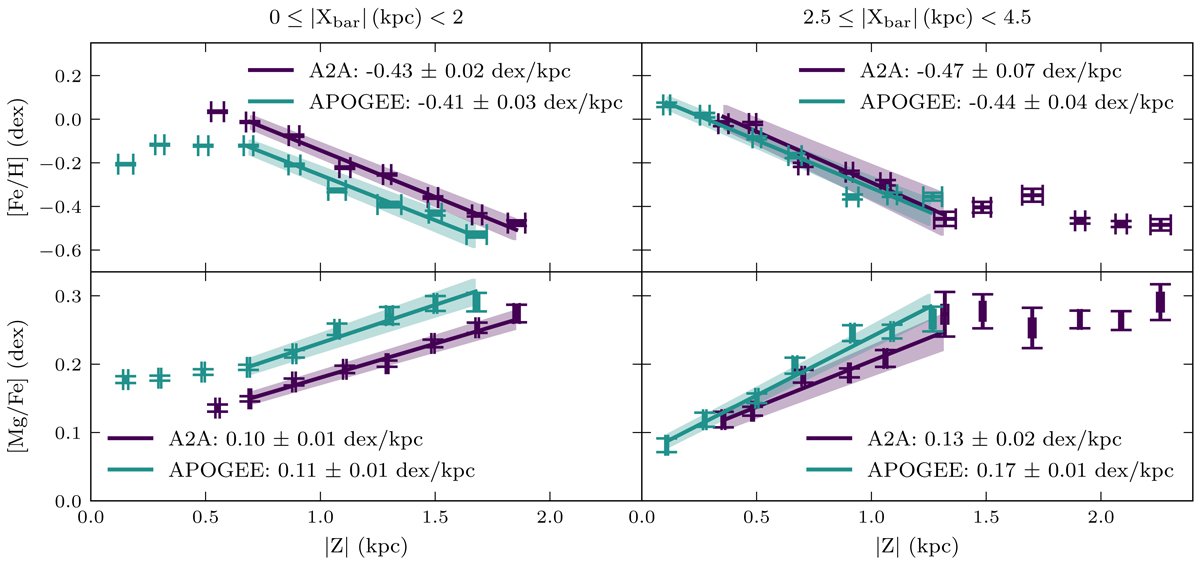
Download original image
SSF-corrected mean [Fe/H] (top row) and [Mg/Fe] (bottom row) vertical abundance profiles for A2A and APOGEE stars in the inner b/p bulge (|Xbar| < 2 kpc, |Ybar| < 1 kpc; left) and long bar-outer bulge regions (2.5 kpc | ≤ Xbar| < 4.5 kpc, |Ybar| < 1 kpc; right). The A2A and APOGEE gradients of the regions shown by the teal and purple lines are given in the legend of each diagram; error ranges of the linear fits are shown by the shaded regions. For all plots, we require the stars to have [Fe/H] > −1 dex.
Current usage metrics show cumulative count of Article Views (full-text article views including HTML views, PDF and ePub downloads, according to the available data) and Abstracts Views on Vision4Press platform.
Data correspond to usage on the plateform after 2015. The current usage metrics is available 48-96 hours after online publication and is updated daily on week days.
Initial download of the metrics may take a while.