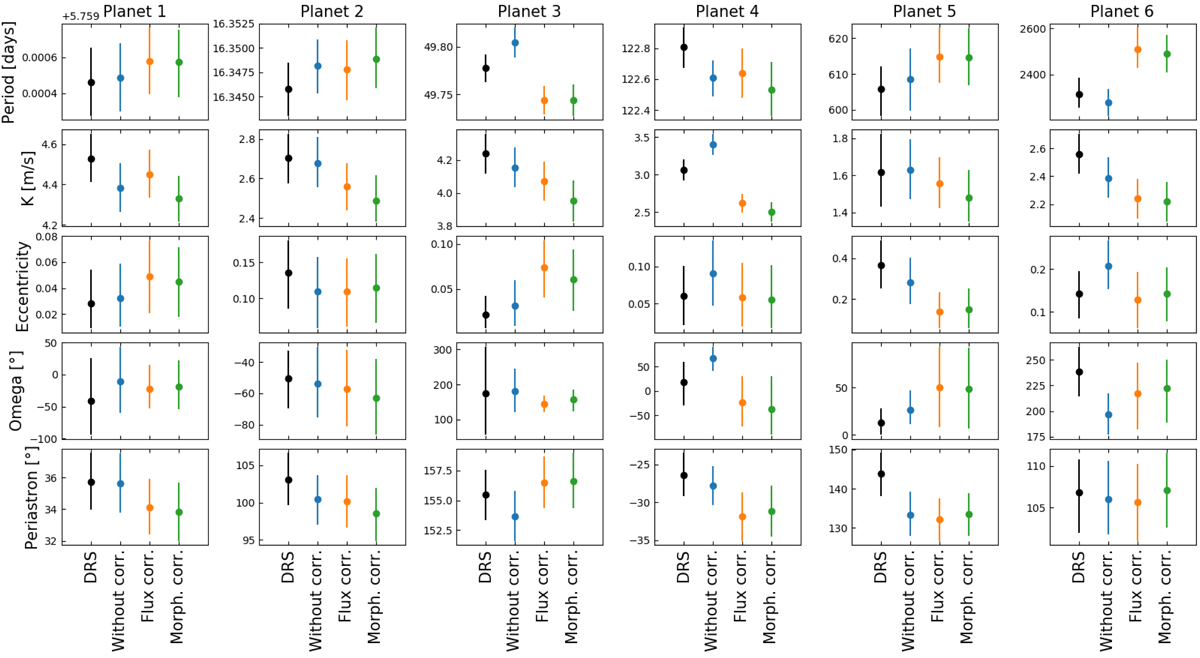
Fig. 16.
Download original image
Marginal distributions of the orbital parameters for the six exoplanets in the HD 10180 dataset obtained with an MCMC sampler. The different datasets analysed are encoded by different colours: the DRS (black dots), our reduction before flux correction (blue dots), after flux correction (orange dots), and after morphological correction (green dots). Each row represents one of the orbital parameters, and each column represents a planet.
Current usage metrics show cumulative count of Article Views (full-text article views including HTML views, PDF and ePub downloads, according to the available data) and Abstracts Views on Vision4Press platform.
Data correspond to usage on the plateform after 2015. The current usage metrics is available 48-96 hours after online publication and is updated daily on week days.
Initial download of the metrics may take a while.