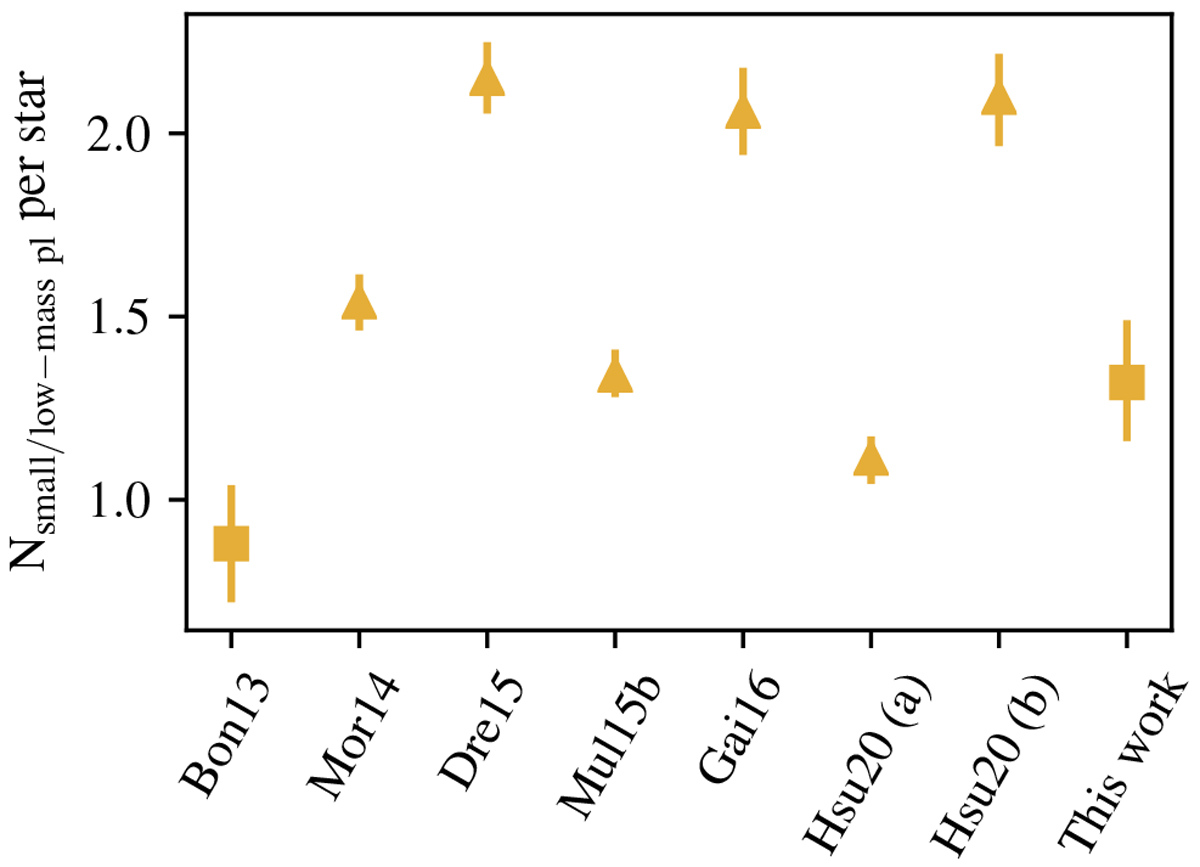
Fig. 12
Download original image
Small or low-mass planet occurrence rate in M dwarfs from different surveys in the ranges of 1–100 d orbital period and 1 R⊕–4 R⊕ or 1 M⊕–10 M⊕. Error bars are derived from the square root of the planets in the sample in all cases to make them comparable. Triangles show the results from the Kepler transit surveys (Morton & Swift 2014; Dressing & Charbonneau 2015; Mulders et al. 2015b; Gaidos et al. 2016; Yang et al. 2020; Hsu et al. 2020) and squares the results from the HARPS and CARMENES RV surveys (Bonfils et al. 2013, and this work).
Current usage metrics show cumulative count of Article Views (full-text article views including HTML views, PDF and ePub downloads, according to the available data) and Abstracts Views on Vision4Press platform.
Data correspond to usage on the plateform after 2015. The current usage metrics is available 48-96 hours after online publication and is updated daily on week days.
Initial download of the metrics may take a while.