Open Access
Fig. H.1.
Download original image
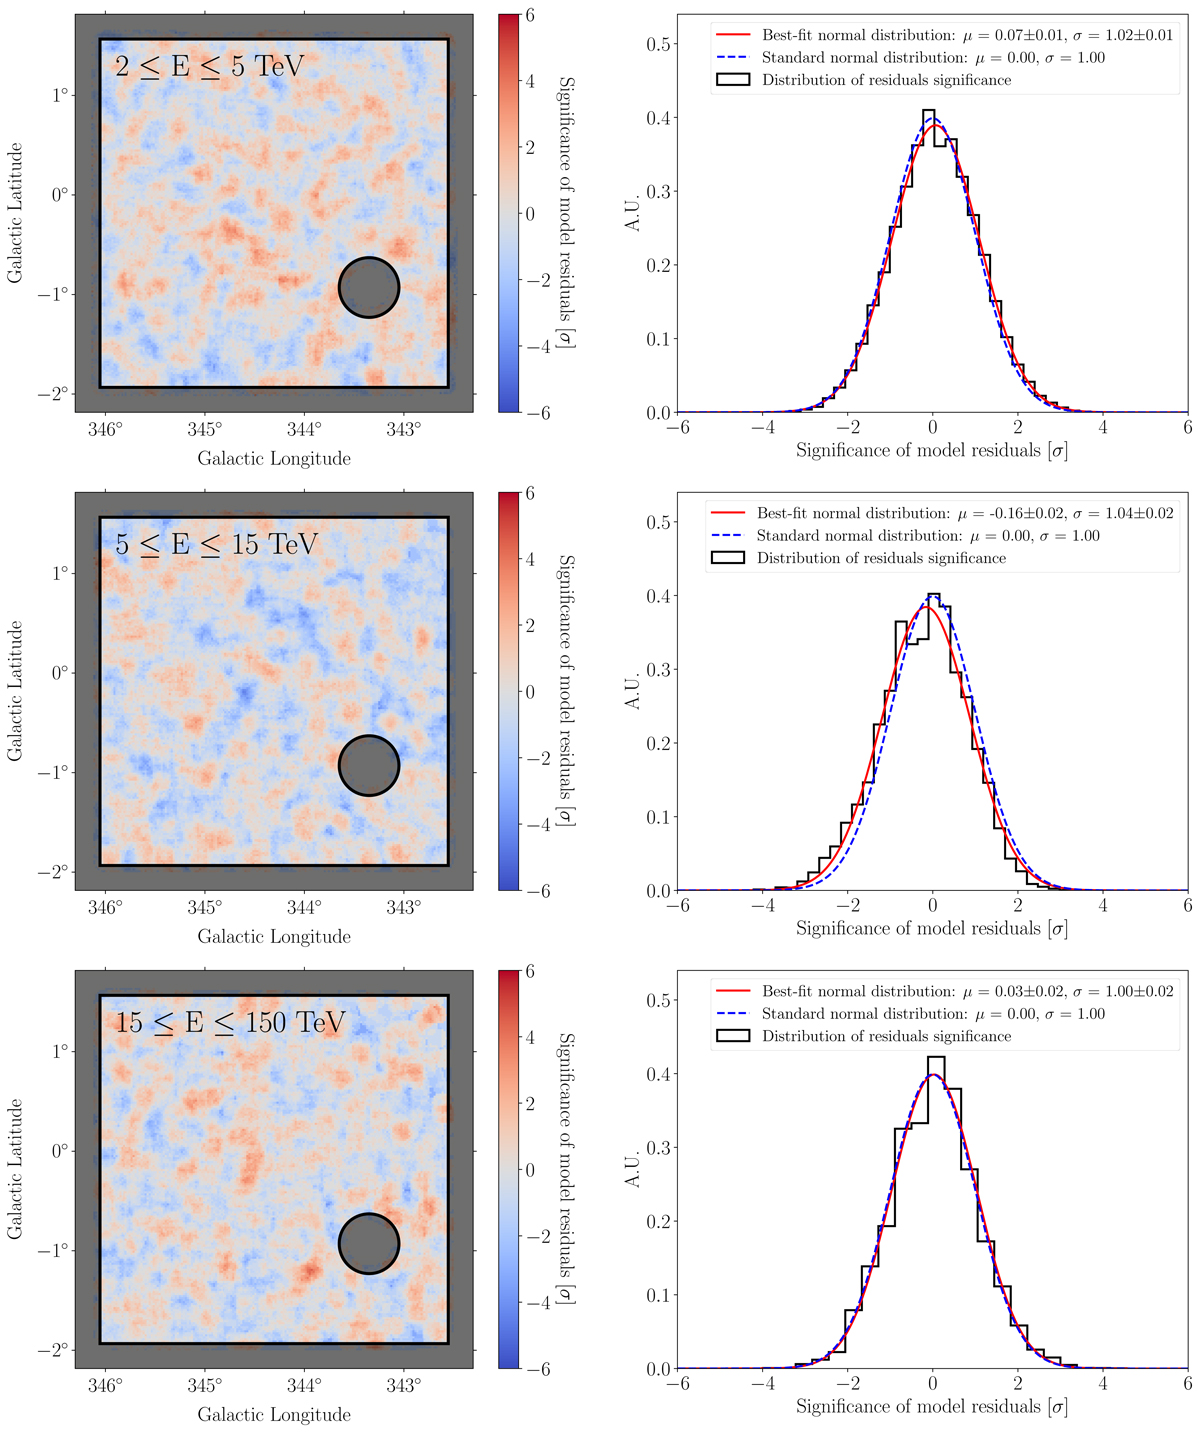
Spatial distributions of the significance of model residuals (left column) and histograms of significance values (right column), computed in the energy bands 2.0−5.0 TeV (first row), 5.0−15.0 TeV (second row) and 15.0−150 TeV (third row).
Current usage metrics show cumulative count of Article Views (full-text article views including HTML views, PDF and ePub downloads, according to the available data) and Abstracts Views on Vision4Press platform.
Data correspond to usage on the plateform after 2015. The current usage metrics is available 48-96 hours after online publication and is updated daily on week days.
Initial download of the metrics may take a while.