Fig. D.1.
Download original image
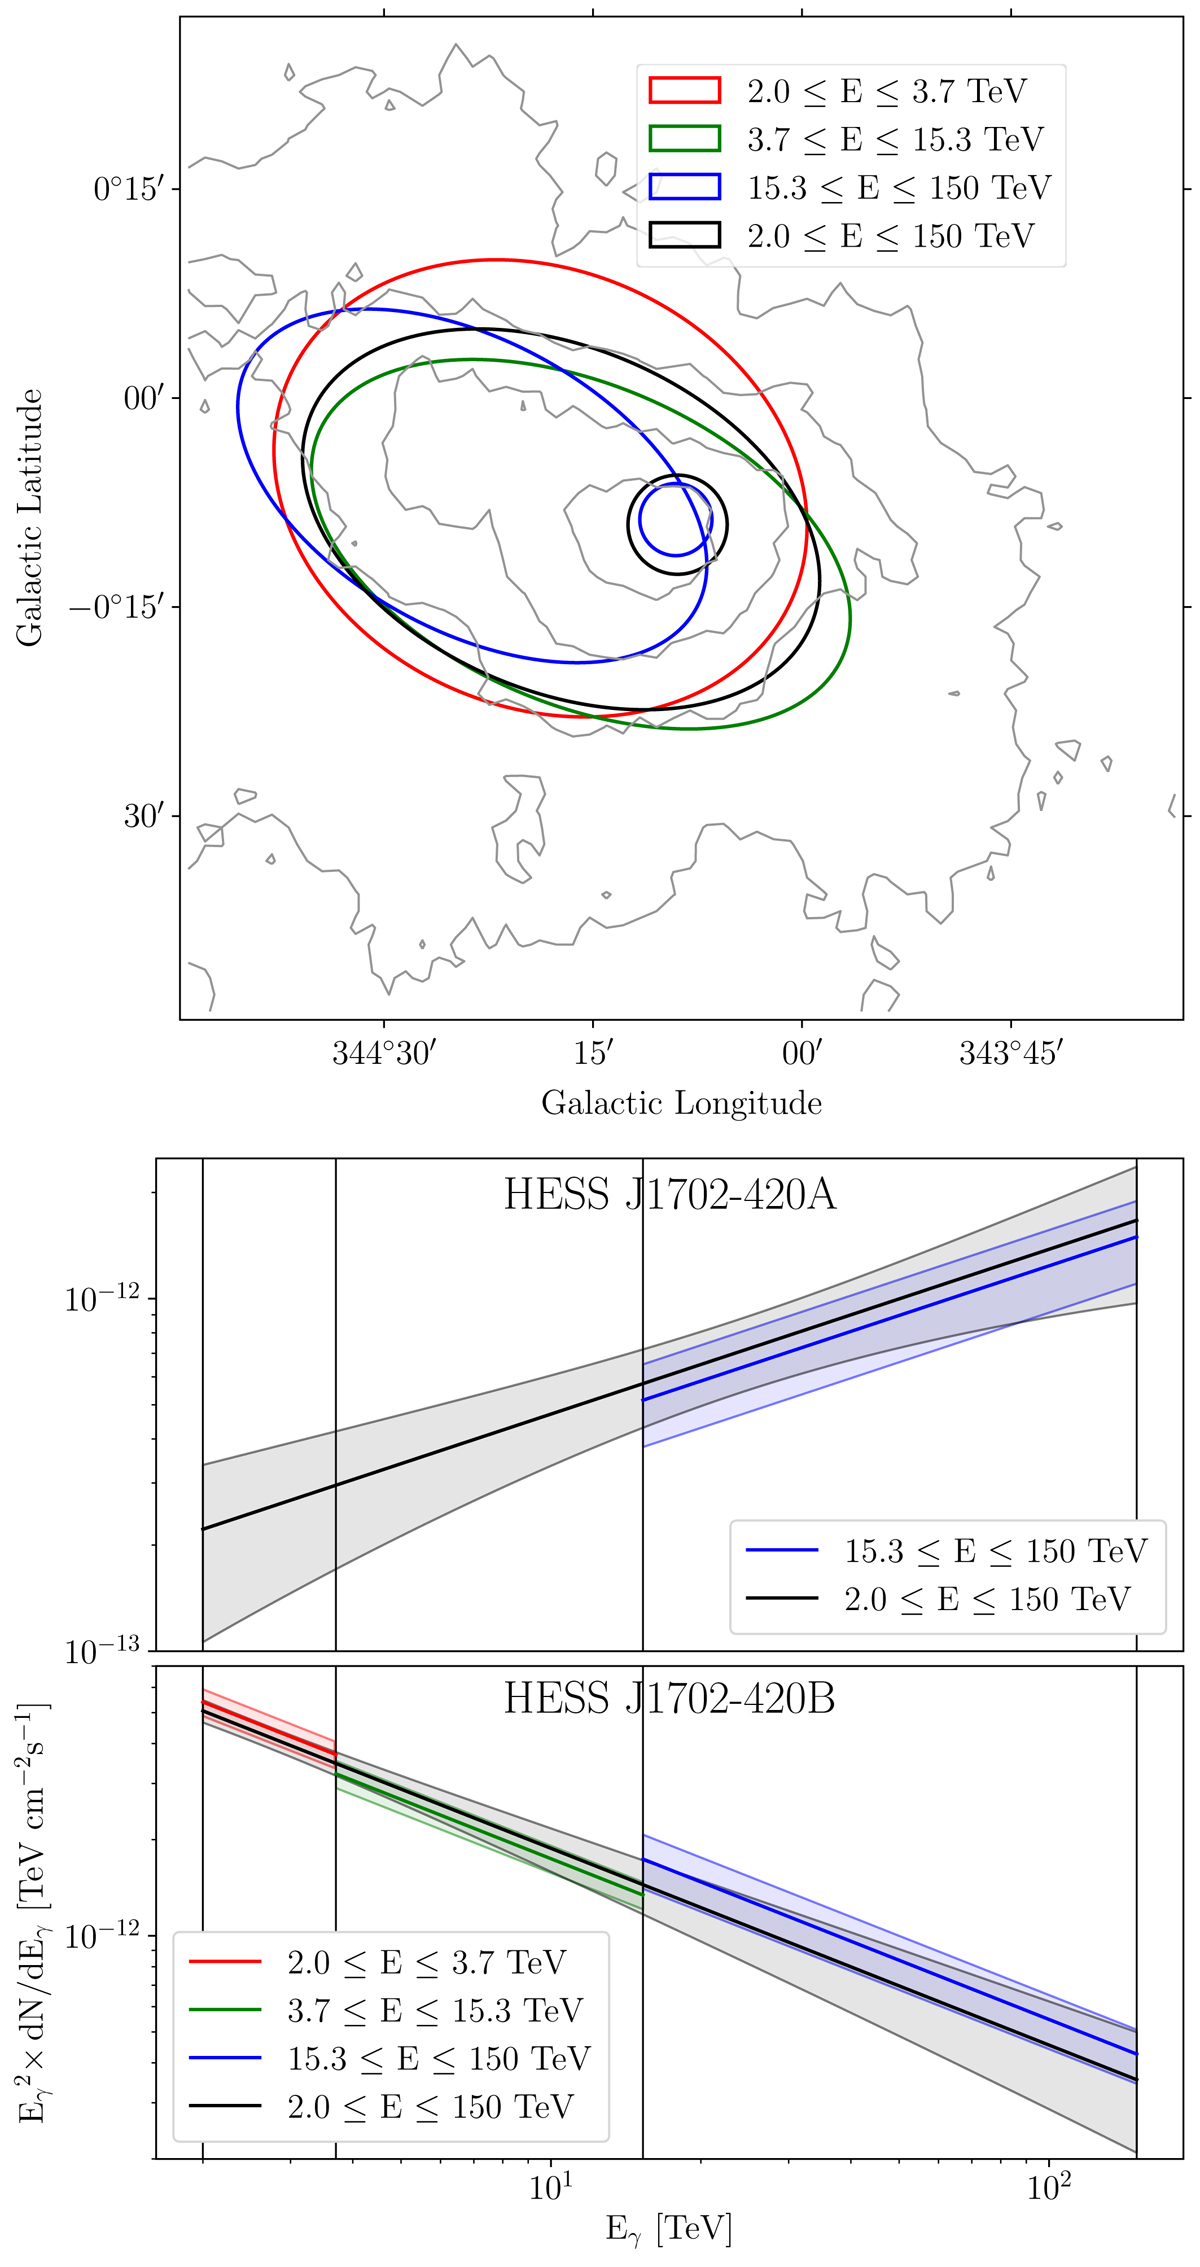
Upper panel: the figure, centered at the approximate position of HESS J1702-420, shows contours corresponding to 150, 200, 250 and 300 counts detected by H.E.S.S. above 2 TeV per smoothing area. Overlaid on the map are the 1σ extension contours of the components HESS J1702-420A and HESS J1702-420B, as obtained from the 3D fit in separate energy bands. Lower panel: spectral results of the energy-resolved 3D analysis, for HESS J1702-420A and HESS J1702-420B. Vertical lines separate the energy bands that were independently used to perform the source modeling. In both panels, the reference results obtained over the full energy range (see Sect. 2.1.3) are indicated in black.
Current usage metrics show cumulative count of Article Views (full-text article views including HTML views, PDF and ePub downloads, according to the available data) and Abstracts Views on Vision4Press platform.
Data correspond to usage on the plateform after 2015. The current usage metrics is available 48-96 hours after online publication and is updated daily on week days.
Initial download of the metrics may take a while.