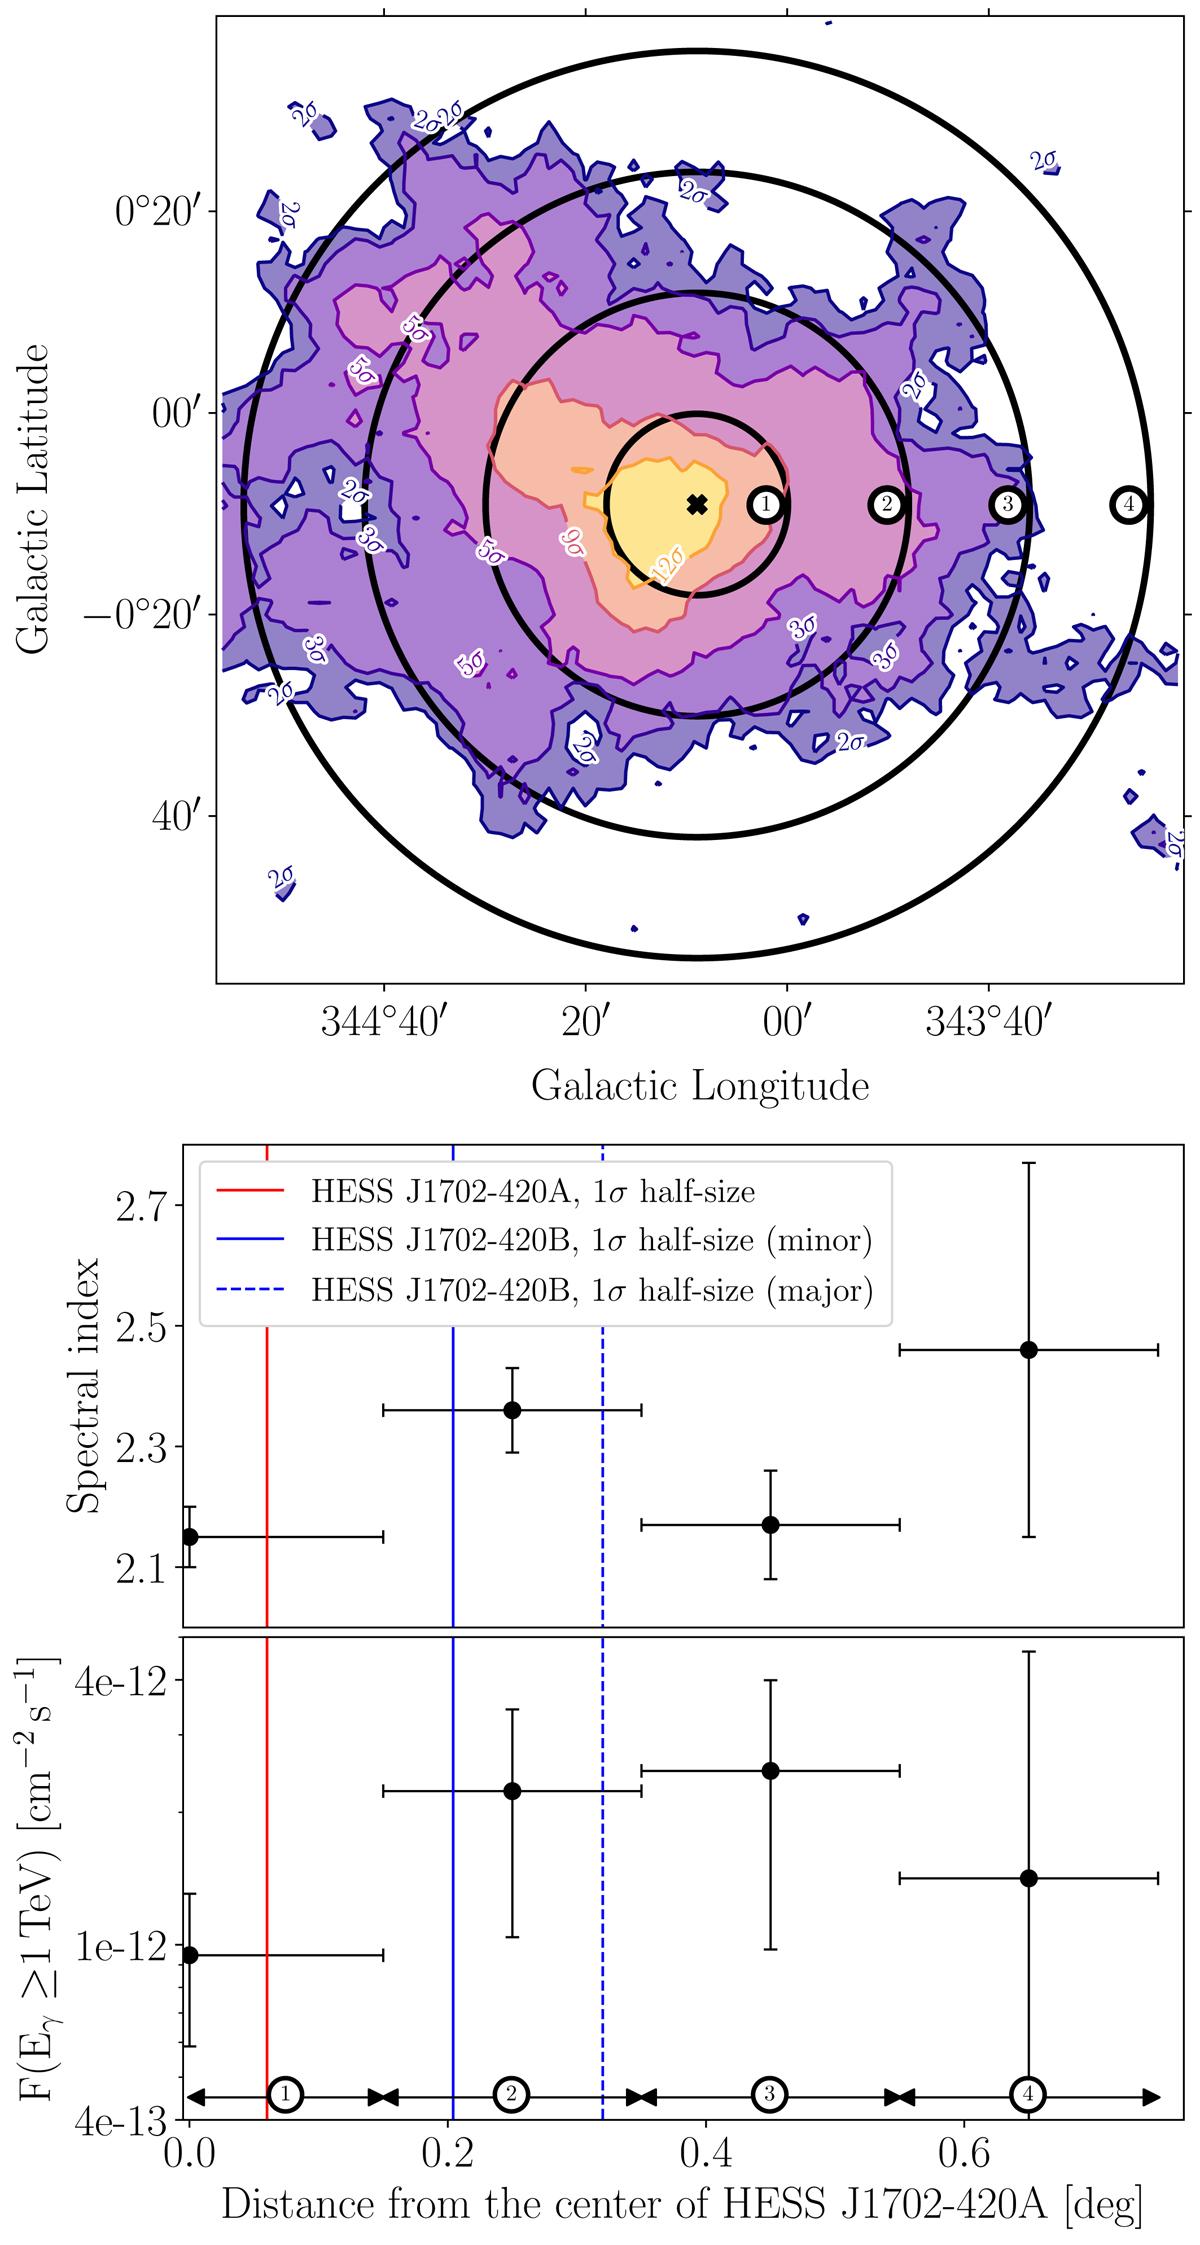
Fig. A.1.
Download original image
Upper panel: Map of the H.E.S.S. γ-ray signal significance above 2 TeV, with contours corresponding to 2σ, 3σ, 5σ, 9σ and 12σ significance levels Li & Ma (1983). The map has been obtained with the Adaptive Ring Background estimation method, and centered at the position of HESS J1702-420A. Overlaid on the map are the concentric regions – one circle and three annuli – that were used to extract the source spectrum. Lower panel: results of the spatially-resolved spectral analysis, showing the spectral index and flux as a function of the distance from HESS J1702-420A.
Current usage metrics show cumulative count of Article Views (full-text article views including HTML views, PDF and ePub downloads, according to the available data) and Abstracts Views on Vision4Press platform.
Data correspond to usage on the plateform after 2015. The current usage metrics is available 48-96 hours after online publication and is updated daily on week days.
Initial download of the metrics may take a while.