Fig. 4.
Download original image
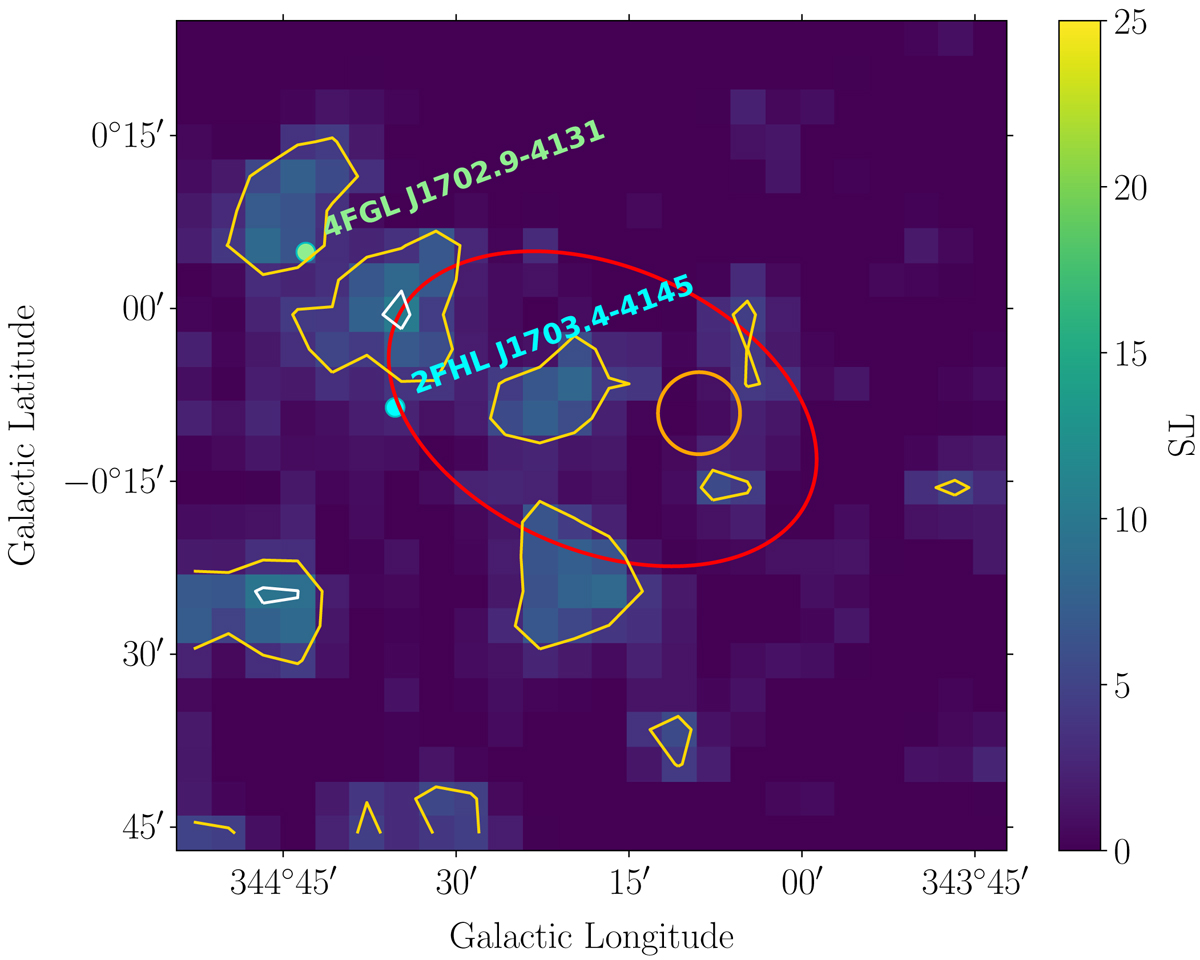
Residual TS map after source modeling in the RoI (see the main text for details). The yellow and white contours represent the TS = 4 (2σ) and TS = 9 (3σ) significance levels, respectively. The red ellipse (orange circle) correspond to the 1σ shape of HESS J1702-420B (HESS J1702-420A). The positions of nearby 4FGL and 2FHL sources are shown as green and cyan circles, respectively.
Current usage metrics show cumulative count of Article Views (full-text article views including HTML views, PDF and ePub downloads, according to the available data) and Abstracts Views on Vision4Press platform.
Data correspond to usage on the plateform after 2015. The current usage metrics is available 48-96 hours after online publication and is updated daily on week days.
Initial download of the metrics may take a while.