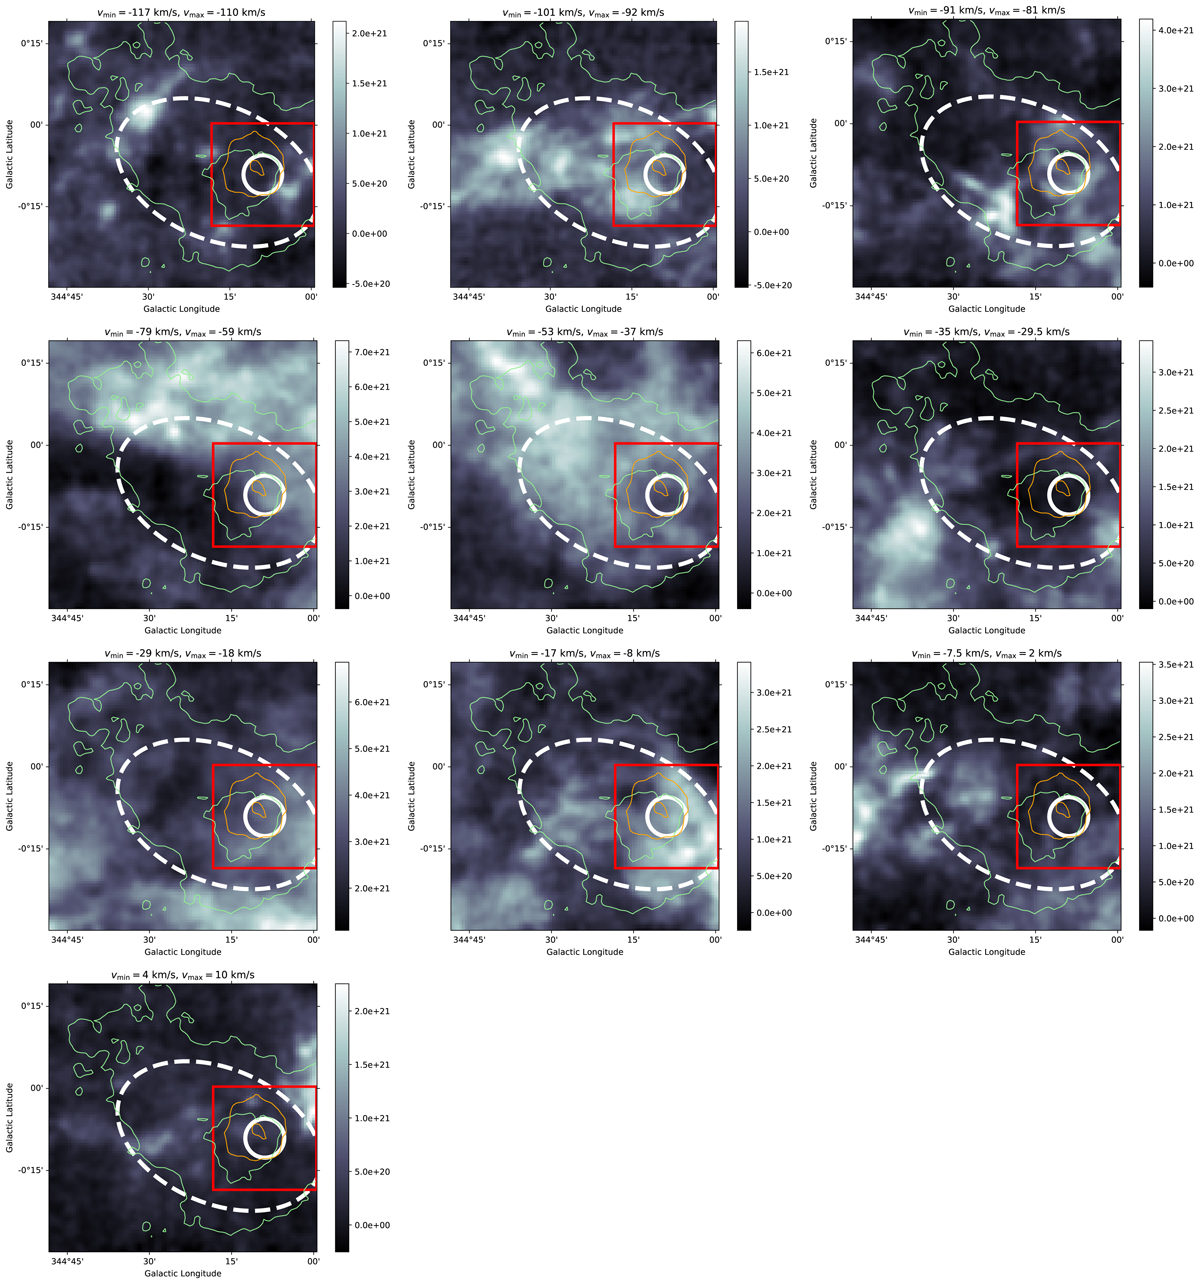
Fig. H.4.
Download original image
Column density maps of molecular hydrogen in the direction of HESS J1702-420, obtained by integrating the brightness temperature profile of 12CO(J = 1 → 0) data from the Mopra radio survey within the velocity intervals indicated above each panel (corresponding to the peaks in Fig. H.3). The brightness temperature values were converted to H2 column density assuming the conversion factor XCO = 1.5 × 1020 cm−2 (K km s−1)−1 (Strong et al. 2004). The green (orange) contours indicate the 5 and 12σ (3 and 5σ) significance levels of the TeV γ-ray flux above 2 TeV (40 TeV). The dashed ellipse and solid circle represent the 1σ morphologies of HESS J1702-420B and HESS J1702-420A, respectively. Finally, the red square – centered at the best-fit position of HESS J1702-420A – indicates the extraction region used to produce the profile reported in Fig. H.3.
Current usage metrics show cumulative count of Article Views (full-text article views including HTML views, PDF and ePub downloads, according to the available data) and Abstracts Views on Vision4Press platform.
Data correspond to usage on the plateform after 2015. The current usage metrics is available 48-96 hours after online publication and is updated daily on week days.
Initial download of the metrics may take a while.