Open Access
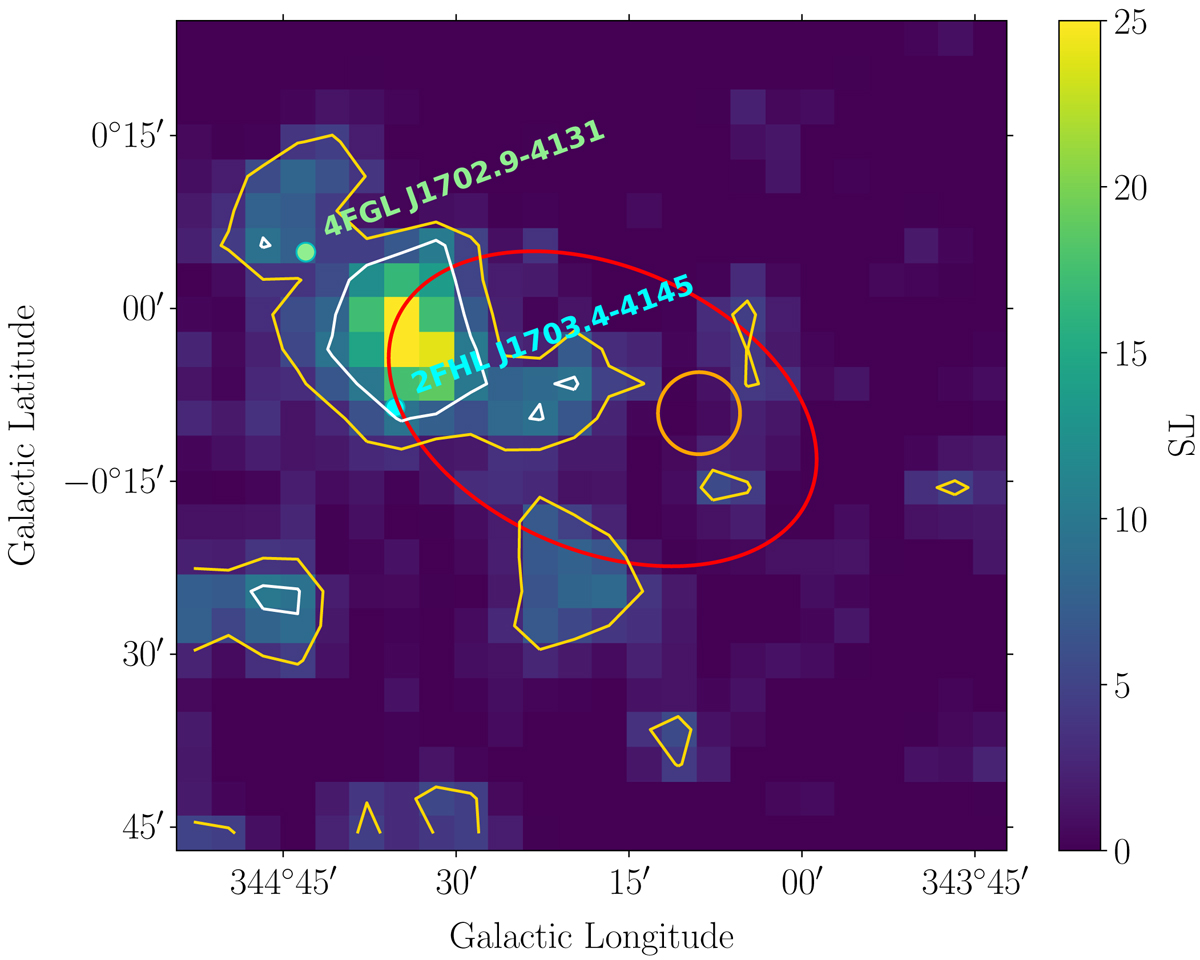
Fig. H.2.
Download original image
Map of test statistic (TS) for the presence of an additional source in the RoI, with respect to a source model containing only the galactic and isotropic γ-ray diffuse sources. The color bar, contours and markers are identical to Fig. 4.
Current usage metrics show cumulative count of Article Views (full-text article views including HTML views, PDF and ePub downloads, according to the available data) and Abstracts Views on Vision4Press platform.
Data correspond to usage on the plateform after 2015. The current usage metrics is available 48-96 hours after online publication and is updated daily on week days.
Initial download of the metrics may take a while.