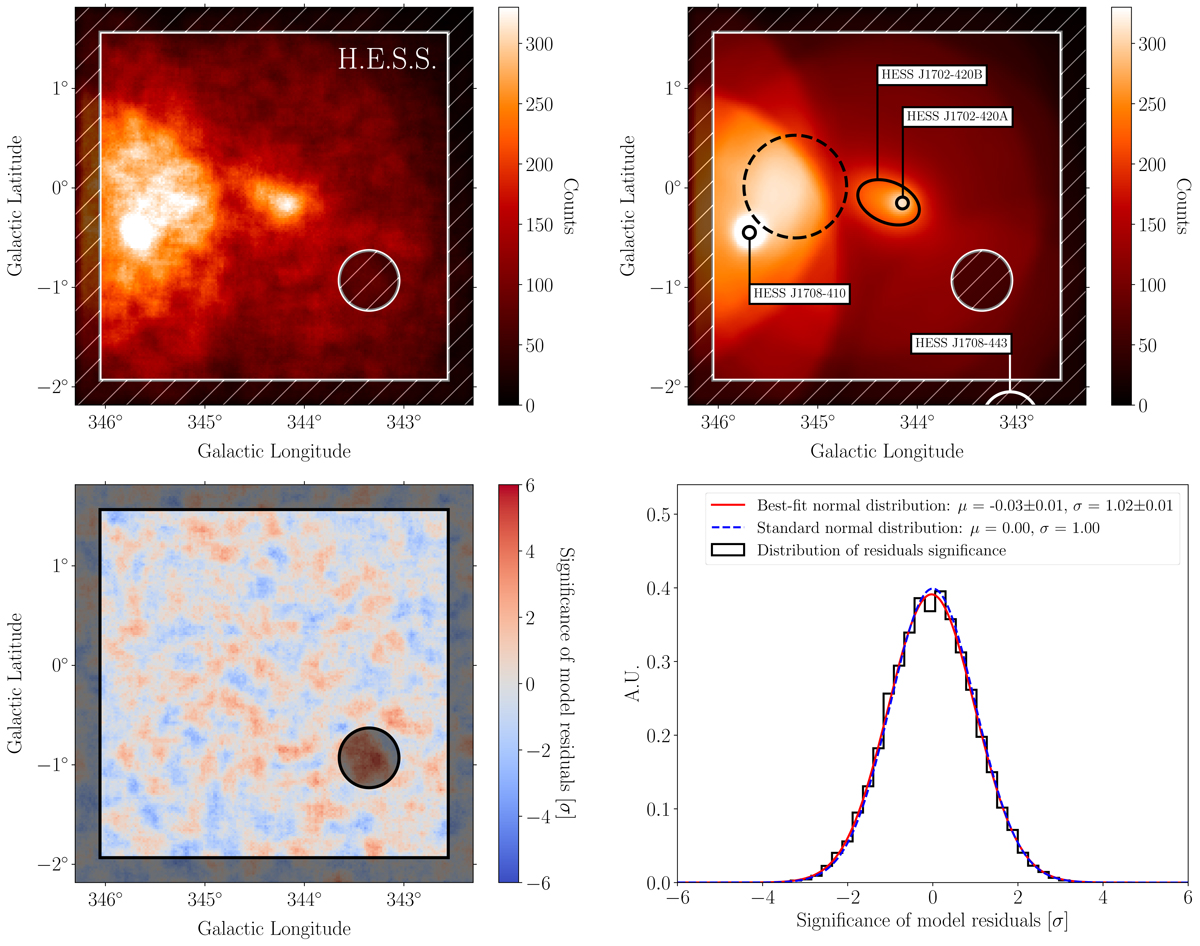
Fig. 1.
Download original image
Upper left panel: image of the RoI obtained by integrating the binned cube of measured counts over the energy axis (E > 2 TeV), and correlating it with a 0.1°-radius top-hat kernel. The hatched regions were excluded from the likelihood computation. The bright area around l ≳ 345° results from deep observations of RX J1713-3946 and HESS J1708-410. Upper right panel: energy-integrated (E > 2 TeV) map of model-predicted counts, with names and 1σ shapes of all model components overlaid. The large-scale discarded component is indicated by the dashed circle – see the main text for more details. Lower left panel: spatial distribution of model residuals, showing the statistical significance – in units of Gaussian standard deviations – of counts – model fluctuations. The image was obtained assuming Cash statistic for Poisson-distributed signals with perfectly known background model (Cash 1979). Lower right panel: histogram containing the number of occurrences of each significance value (assuming Cash statistic), from the lower left panel. The adjustment of a Gaussian function to the histogram is shown, together with a reference standard normal distribution.
Current usage metrics show cumulative count of Article Views (full-text article views including HTML views, PDF and ePub downloads, according to the available data) and Abstracts Views on Vision4Press platform.
Data correspond to usage on the plateform after 2015. The current usage metrics is available 48-96 hours after online publication and is updated daily on week days.
Initial download of the metrics may take a while.