Fig. 3.
Download original image
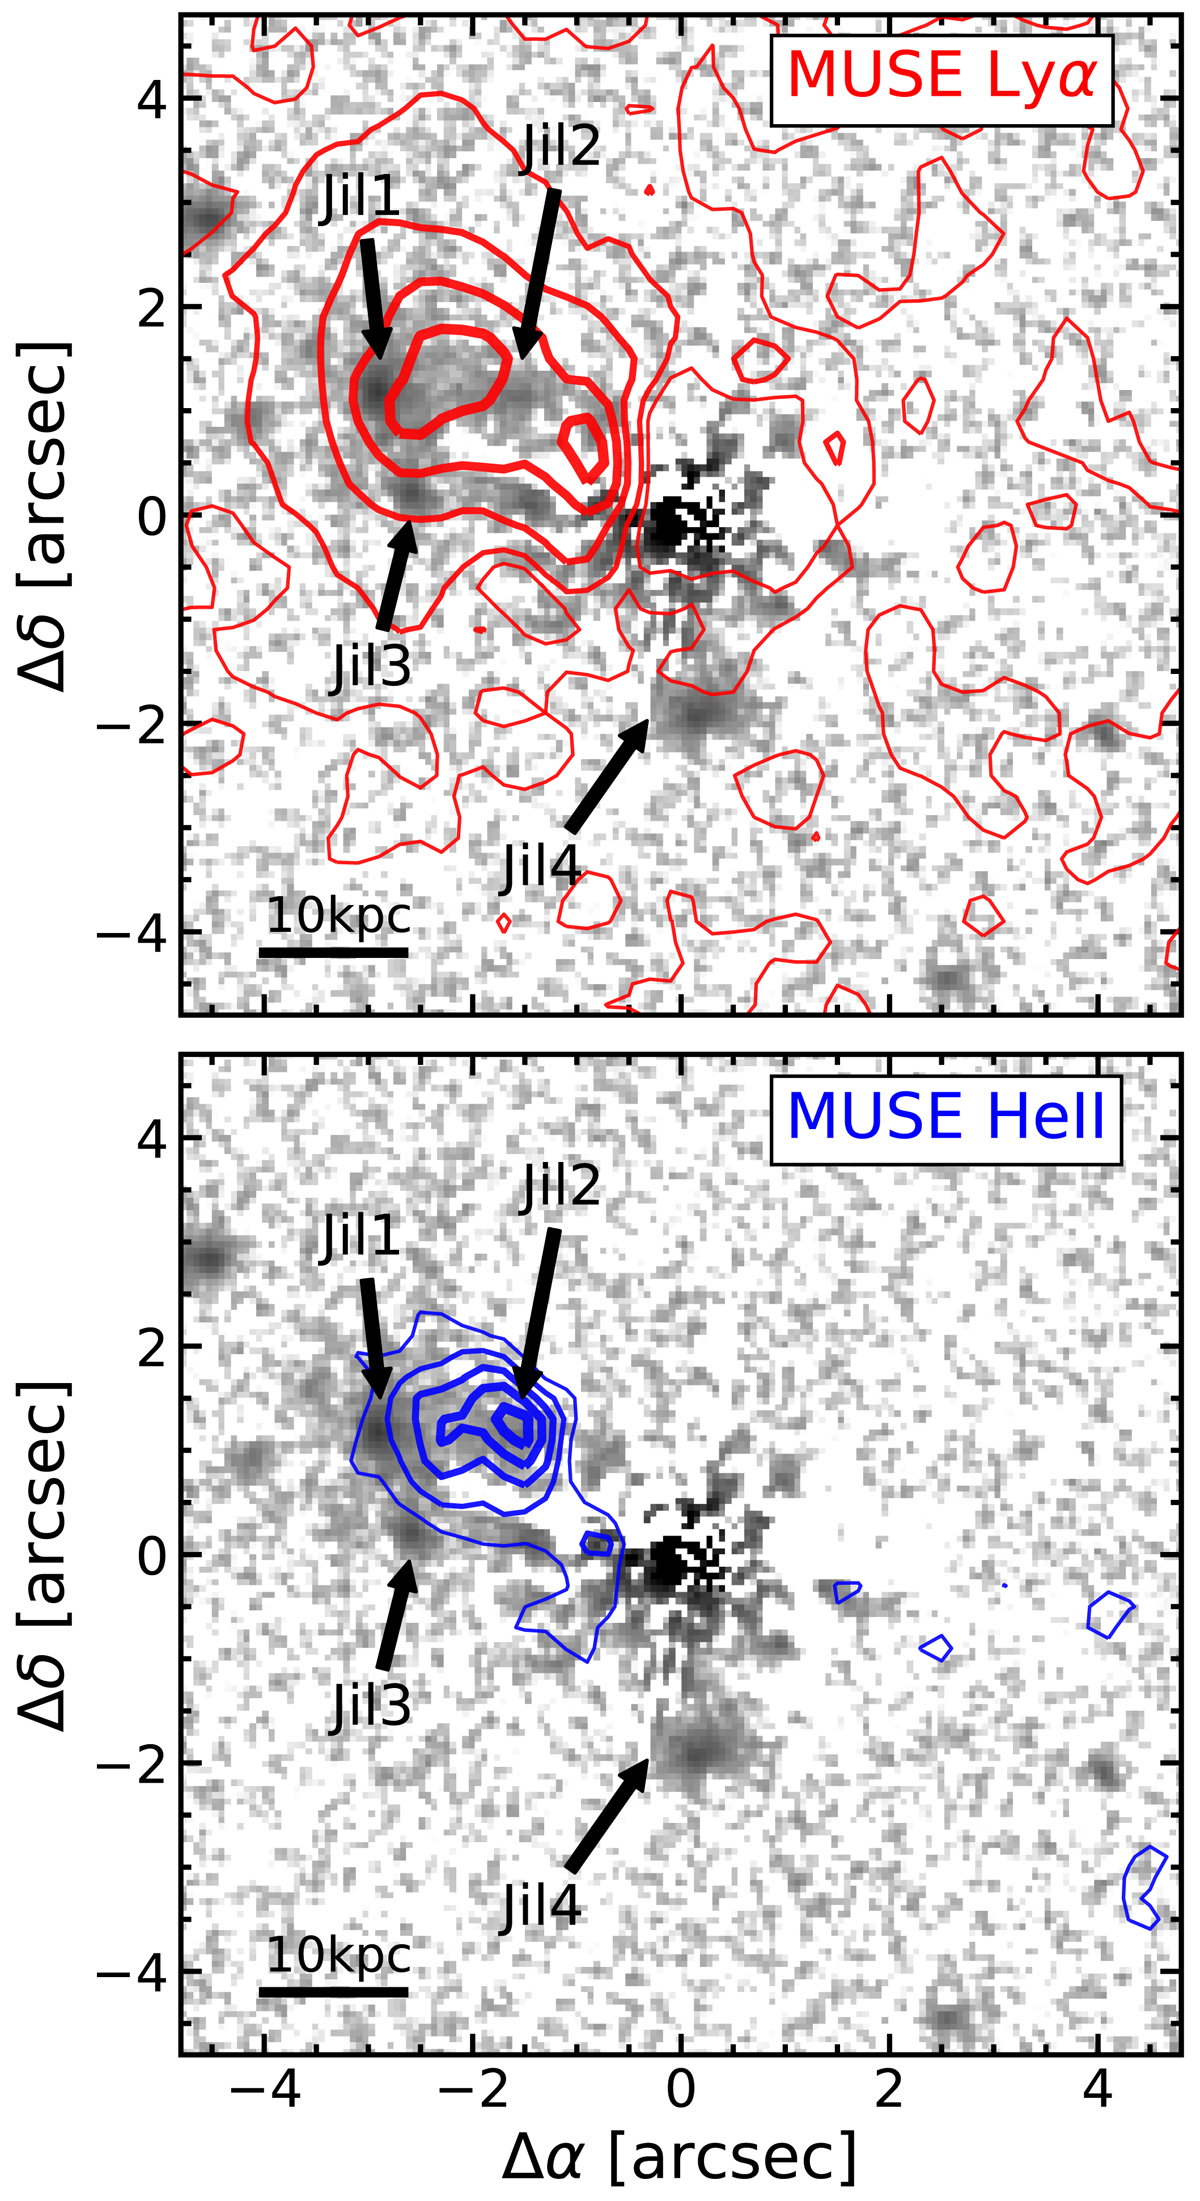
Comparison of the Lyα and He II emission line distribution with the HST continuum light. The QSO-subtracted WFC3 F125W image is shown in grey scale using a logarithmic scaling. The QSO-subtracted Lyα and He II centred narrow-band images obtained with MUSE are shown as red and blue contours in the upper and lower panel, respectively. Contour levels represent isophotes at ΣLyα = [1, 2, 4, 6, 8] × 10−17 erg s−1 cm−2 arcsec−2 and ΣHe II = [0.4,0.6,0.8,1.0,1.2] × 10−17 erg s−1 cm−2 arcsec−2, respectively. The Lyα extends slightly beyond the shown field at lower surface brightness levels. The MUSE maps were smoothed with a one-pixel-wide Gaussian to suppress noise, as presented in Paper I. The HST and MUSE images are empirically registered based on the accurate position of the bright QSO.
Current usage metrics show cumulative count of Article Views (full-text article views including HTML views, PDF and ePub downloads, according to the available data) and Abstracts Views on Vision4Press platform.
Data correspond to usage on the plateform after 2015. The current usage metrics is available 48-96 hours after online publication and is updated daily on week days.
Initial download of the metrics may take a while.